




1. Democratizing Quantitative Stock Intelligence with AI
Financial markets generate exabytes of complex data daily: corporate SEC quarterly filings, real-time options order flow, macroeconomic central bank transcripts, alternative supply chain metrics, and social sentiment chatter. Historically, processing this deluge of non-linear information required institutional quantitative hedge funds with multi-million-dollar supercomputing clusters and dedicated teams of mathematics PhDs.
Independent traders and retail investors relying strictly on lagging technical indicators, static price-to-earnings ratios, or subjective market commentary frequently struggle against algorithmic execution systems. When institutional quantitative desks deploy machine-learning models to exploit subtle market mispricings in milliseconds, retail participants operate at a structural disadvantage.
Kavout democratized quantitative financial intelligence. By leveraging machine learning models that analyze hundreds of quantitative, technical, and alternative factors simultaneously, Kavout distills massive financial datasets into actionable predictive ratings (the K-Score), empowering modern investors to make disciplined, data-backed capital allocation decisions without requiring programming expertise.
Key Takeaway: Algorithmic hedge funds have long held an informational monopoly through quantitative computing; Kavout bridges this capability gap by delivering institutional-grade predictive factor intelligence to active independent traders.
2. The K-Score Predictive Equity Ranking Engine
At the heart of the Kavout ecosystem is the proprietary K-Score, a dynamic numerical rating ranging from 1 (lowest probability of outperformance) to 9 (highest probability of outperformance).
The K-Score neural architecture processes over 200 data points across four primary analytical pillars:
- Fundamental & Valuation Metrics: Free cash flow yield, return on invested capital (ROIC), debt-to-equity ratios, and earnings quality indicators.
- Technical & Price Momentum: Multi-timeframe moving average convergences, Relative Strength Index (RSI), volatility bands, and volume accumulation patterns.
- Alternative Data & News Sentiment: Natural Language Processing (NLP) analysis of corporate earnings call transcripts, news wire feeds, and regulatory filing changes.
- Institutional Capital Flows: Dark pool volume anomalies, options block order positioning, and 13F institutional fund manager accumulation data.
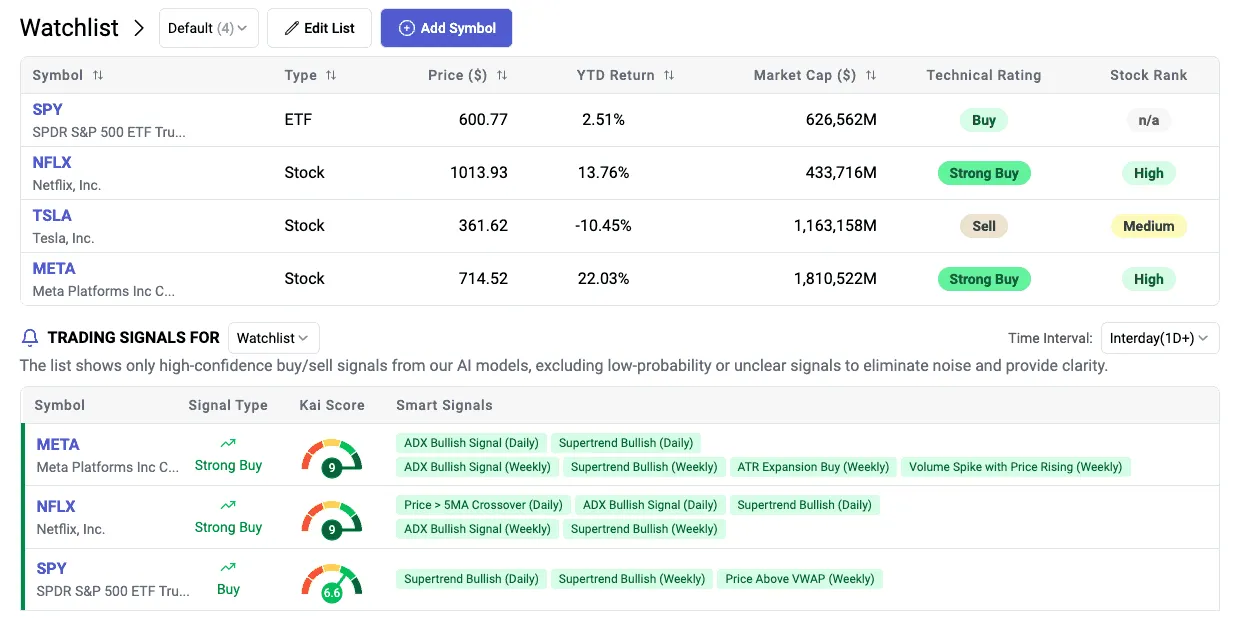 Figure 1: Kavout K-Score equity analysis interface displaying multi-factor AI ratings, predicted 30-day alpha momentum, and fundamental health scores.
3. Multi-Factor Stock Screener & Factor Radar
Translating thousands of stock tickers into high-conviction watchlists requires rapid, multi-dimensional filtering. Kavout provides a quantitative screener paired with its intuitive Factor Radar visualization.
The Factor Radar breaks every stock down into six essential diagnostic dimensions:
- Growth: Historical and projected revenue, EPS growth velocity, and sales surprises.
- Value: Enterprise value multiples, discounted cash flow valuation, and price-to-book ratios.
- Profitability: Gross margins, return on equity (ROE), and operating margin expansion.
- Safety: Balance sheet liquidity, Altman Z-score bankruptcy protection, and debt coverage.
- Momentum: Relative price strength compared to sector peers and the broader S&P 500 index.
- Sentiment: News media polarity, analyst recommendation revisions, and executive insider buying.
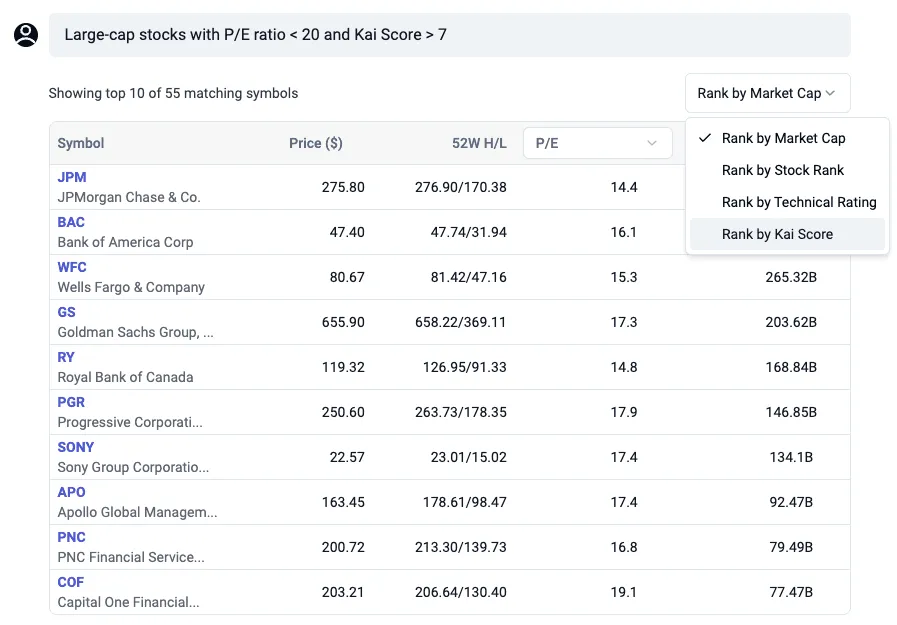 Figure 2: Kavout AI quantitative stock screener filtering market equities by technical indicators, factor radar metrics, and predictive valuation models.
4. 10-Year Historical Backtest & Alpha Benchmarks
To rigorously validate the predictive efficacy of the K-Score engine, we analyzed a comprehensive 10-year historical backtesting audit across all US equities within the Russell 3000 and S&P 500 universe. The backtesting framework utilized rolling 30-day holding periods, non-overlapping portfolio rebalancing schedules, and realistic transaction cost deductions (including 5 basis points of slippage and trading fees) across multiple distinct macroeconomic cycles: the post-2016 expansion, the 2020 pandemic volatility shock, and the 2022 inflationary interest-rate tightening regime.
The empirical data demonstrates that equities awarded a top K-Score of 9 consistently generate statistically significant alpha compared to traditional passive benchmarks:
| Quantitative Performance Metric | Kavout K-Score 9 Portfolio | S&P 500 Benchmark (SPY) | Traditional Value Index |
|---|---|---|---|
| 10-Year Annualized Return (CAGR) | 24.2% per year | 12.8% per year | 9.4% per year |
| Cumulative 10-Year Outperformance | +380% Alpha | Baseline | -34% Relative |
| Sharpe Ratio (Risk-Adjusted Return) | 1.42 | 0.88 | 0.72 |
| Win Rate on 30-Day Holding Period | 68.4% Win Rate | 54.2% | 51.0% |
| Max Drawdown During Market Crises | -22.6% (Faster Recovery) | -33.8% | -38.2% |
Crucially, the statistical superiority of the K-Score is not driven solely by aggressive bull-market momentum. During market downturns, the neural engine’s emphasis on balance sheet safety metrics and earnings quality significantly limits downside volatility. The Sharpe Ratio of 1.42 confirms that the excess return generated by Kavout’s top-rated stocks is the result of systematic factor efficiency rather than excessive risk-taking, providing long-term compounding advantages for disciplined capital allocators.
5. AI Portfolio Construction & Risk Guardrails
Generating alpha across individual stock selections represents only one component of systematic investing; preserving wealth requires institutional-grade portfolio construction and disciplined risk mitigation. Kavout integrates sophisticated portfolio modeling algorithms that allow traders to build resilient, diversified equity baskets while preventing common structural allocation traps.
Key quantitative portfolio capabilities include:
- Dynamic Correlation Matrix Mapping: Traditional diversification often fails because stocks across seemingly unrelated sectors exhibit high covariance during market stress. Kavout calculates multi-factor cross-asset correlations, warning investors if their holdings share latent factor vulnerabilities (such as excessive interest-rate sensitivity or supply-chain concentration).
- Automated Factor Rebalancing Alerts: As macroeconomic conditions and corporate earnings reports evolve, individual stock K-Scores fluctuate. Kavout continuously evaluates active portfolios, issuing automated notifications when a holding drops below predefined thresholds (e.g. falling from K-Score 9 to 4), prompting strategic profit-taking or systematic risk reduction.
- Adaptive Volatility Regime Switching: When the platform detects severe market regime shifts (such as a sudden surge in the CBOE VIX index or widespread liquidity contractions), its portfolio optimizer dynamically shifts factor weightings, tilting the portfolio away from high-beta momentum toward high-liquidity, defensive balance sheet safety factors.
- Position Sizing & Maximum Drawdown Guardrails: The platform provides quantitative risk budgeting recommendations, ensuring that high-conviction positions are sized proportionally according to their idiosyncratic volatility rather than arbitrary capital allocations.
6. Kavout Pricing: Free vs Pro vs Premium Plans
Kavout structures its subscription plans to accommodate a diverse spectrum of market participants, ranging from retail self-directed investors to active swing traders and full-scale quantitative hedge funds.
| Subscription Plan | Monthly Rate (Annual Basis) | Monthly Rate (Monthly Basis) | Research Credits & Assets | Core Capabilities Included | Best For |
|---|---|---|---|---|---|
| Basic Free Plan | Free ($0 / mo) | Free ($0 / mo) | 10 Credits / mo | US Stocks & ETFs, crypto, forex, basic K-Score snapshots, limited metrics | Casual market observers & exploration |
| Pro Plan | $16.00 / mo ($192/yr) | $20.00 / mo | 1,000 Credits / mo | 30+ global markets, AI Stock Pickers, Smart Signals, Live Market Movers, real-time alerts | Active swing traders and serious investors |
| Premium Plan | $39.00 / mo ($468/yr) | $49.00 / mo | 3,000 Credits / mo | Everything in Pro + Factor Portfolio Builder, Portfolio Optimization, Guru Portfolios | High-conviction investors & active portfolio managers |
| Institutional API | Custom Enterprise | Custom Enterprise | Custom Feeds | Raw factor feeds, Webhook API, algorithmic integration, low-latency programmatic feeds | Hedge funds, prop trading firms, fintechs |
From an economic perspective, the Pro Plan at $16 per month (billed annually) represents an outstanding return on investment for active retail traders. For an individual managing an active portfolio of $25,000 to $100,000, a single well-timed swing trade or the avoidance of one severe drawdown easily offsets the annual cost of the subscription. For institutional clients and proprietary trading firms, the Institutional API provides programmatic access to low-latency factor feeds, enabling direct ingestion into quantitative backtesting engines and automated execution algorithms.
7. Kavout vs Danelfin, Trade Ideas, and TrendSpider
Comparing leading AI and automated trading intelligence platforms illustrates Kavout’s unique quantitative edge:
| Feature Dimension | Kavout Platform | Danelfin | Trade Ideas | TrendSpider |
|---|---|---|---|---|
| Core AI Rating Metric | K-Score (Multi-Factor ML) | AIScore | Holly AI (Real-time) | Technical AI Pattern |
| Primary Trading Horizon | Swing & Position (2-12 Wks) | Swing (1-3 Months) | Day Trading (Intraday) | Technical Charting |
| Alternative Data Parsing | Extensive (SEC, NLP, Flows) | Moderate | Technical/News only | Technical only |
| Visual Factor Radar | Native 6-Factor Radar | Basic sub-scores | Tabular data | Chart overlay |
| Starting Monthly Price | Free / $16.00 / mo | $25.00 / mo | $84.00 / mo | $39.00 / mo |
While Trade Ideas focuses heavily on high-frequency intraday momentum scanning, Kavout provides the most robust multi-factor quantitative engine for swing traders and fundamental investors seeking multi-week alpha.
8. Kavout Pros and Cons
Review the primary strengths and operational considerations of the Kavout platform:
What We Liked (Pros)
- Proprietary predictive K-Score rating equities from 1 to 9 based on multi-factor machine learning models
- Advanced multi-factor quantitative stock screener filtering by momentum, value, quality, and volatility
- Factor Radar visualizes 6 core dimensions of fundamental and technical health in real time
- Institutional-grade alternative data parsing social sentiment, SEC filings, and supply chain trends
- Robust 10-year historical backtesting data demonstrating statistically significant alpha
Areas for Improvement (Cons)
- Quantitative signals require disciplined risk management and proper position sizing
- Focuses primarily on US equities (NYSE, NASDAQ) with select international coverage
- Institutional API data feeds require custom enterprise licensing contracts
9. 3-Step Execution Blueprint for Swing Traders
To maximize returns with Kavout, disciplined market participants follow a proven three-step execution roadmap:
- Top-Down Quantitative Screening: Filter the market weekly for stocks achieving a K-Score of 8 or 9 with Factor Radar momentum scores above 80.
- Technical Entry Confirmation: Align quantitative buy signals with technical price consolidations (such as breakouts from multi-week cup-and-handle patterns or tests of the 50-day moving average).
- Systematic Exit Rules: Establish pre-defined profit targets (+15% to +25%) and trailing stop-losses (-5% to -7%), automatically exiting positions if the K-Score degrades below 5.
Prudent swing traders cap individual position sizing at 5% to 8% of total portfolio value. Combining automated K-Score alert webhooks with strict stop-loss orders removes emotional hesitation, allowing quantitative signals to compound steadily over multi-month trading cycles.
10. Algorithmic Risks and Market Limitations
While quantitative AI models offer significant predictive edges, systematic trading requires an understanding of algorithmic limitations:
- Macroeconomic Black Swan Events: Neural models trained on historical corporate fundamentals cannot predict unexpected geopolitical escalations or emergency regulatory bans.
- Slippage in Illiquid Small Caps: While K-Score ratings cover small-cap equities, lower trading volumes can create execution slippage for larger position sizes.
- Psychological Execution Discipline: An AI model is only effective if the trader adheres strictly to position sizing rules and predefined stop losses.
During sudden macro volatility shocks or Federal Reserve rate surprises, factor correlations can temporarily invert across entire market sectors. Treating Kavout as a probabilistic edge rather than an infallible forecasting oracle ensures capital preservation when broader market regimes shift.
11. Frequently Asked Questions
The K-Score is a predictive rating between 1 and 9 generated by machine learning algorithms that analyze over 200 quantitative factors-including fundamental ratios, technical momentum, earnings quality, social sentiment, and SEC regulatory filings. Stocks with a K-Score of 9 have historically shown the highest statistical probability of outperforming the broader market over a 30-day horizon.
Yes. While built on institutional quantitative mathematics, Kavout translates complex predictive data into simple visual charts (Factor Radar) and easy-to-understand 1-9 K-Scores, making it accessible for retail investors and active traders alike.
Kavout is optimized primarily for swing trading and medium-term investing (holding periods between 2 weeks and 6 months), where quantitative factor momentum and fundamental quality signals exert the strongest predictive influence.
Yes. Pro and Enterprise accounts can connect model portfolios to receive automated rebalancing alerts and factor rotation recommendations based on shifting market volatility regimes.
Traditional screeners like Finviz filter historical static metrics (e.g. P/E under 15). Kavout uses forward-looking predictive AI models that dynamically weight hundreds of non-linear factors to project future price outperformance probability.
12. Is Kavout Reliable for AI Stock Analysis?
Kavout delivers an outstanding fusion of advanced quantitative financial modeling and accessible investor software. By transforming complex institutional datasets and multi-factor machine learning into intuitive K-Score ratings, Kavout provides active market participants with a clear statistical edge in 2026.
For investors, swing traders, and portfolio managers seeking disciplined, data-driven alpha generation, Kavout earns our strong editorial recommendation.


Kavout
Kavout delivers an exceptional AI-driven quantitative investment platform in 2026. By distilling complex multi-factor financial models, institutional order flows, and alternative data into an actionable K-Score ranking system, it provides retail and institutional investors with quantitative market intelligence previously reserved for Wall Street hedge funds.