




1. Marketing Data Fragility in Enterprise Reporting
Every digital marketing agency remembers the dreaded Monday morning reporting catastrophe. A client executive opens their critical performance dashboard minutes before a quarterly board review, only to find every return-on-ad-spend scorecard displaying red configuration errors.
These sudden reporting breakdowns rarely stem from dashboard layout mistakes. Instead, upstream advertising networks silently deprecate an Application Programming Interface (API) dimension, causing legacy connectors to fail without warning.
Managing manual data collection across Meta Ads, Google Ads, TikTok Ads, and Google Analytics 4 quickly turns into an administrative nightmare. Performance analysts waste twenty hours every week downloading fragmented CSV files, reformatting date columns, and copying cells into presentation decks.
This detailed Supermetrics review evaluates how the Finnish data integration pioneer solves marketing data fragility. Founded in Helsinki in 2013 by Mikael Thuneberg, Supermetrics has grown from a humble spreadsheet macro into an enterprise pipeline serving over 750,000 marketers and 17,000 businesses worldwide.
The platform specializes in Extract, Transform, Load (ETL) workflows engineered specifically for marketing analytics. Rather than requiring technical data engineers to write complex Python ingestion scripts, Supermetrics delivers prebuilt connectors that normalize marketing metrics automatically.
Growth marketing teams face intense pressure to prove cross-channel return on investment. Relying on disconnected vendor reporting consoles leaves substantial attribution blind spots that distort budget allocation decisions.
Consolidating campaign performance across search, paid social, ecommerce stores, and offline telephone inquiries requires robust pipeline infrastructure. Marketing teams often pair Supermetrics with call attribution data from lead tracking attribution data from WhatConverts to bridge offline conversions with digital spend metrics.
When disparate data streams converge inside a unified analytics warehouse, marketing directors finally obtain truthful unit economics. They stop guessing which creative variations drove pipeline revenue and begin allocating capital with mathematical confidence.
The cost of data fragmentation extends beyond wasted analyst hours. When campaign managers act on delayed metrics, underperforming ad sets burn thousands of dollars before anyone identifies poor conversion efficiency.
2. Core Connector Architecture Behind Automated Schema Normalization
The primary strength of Supermetrics lies in its extensive connector catalog. The platform maintains certified connections to over 150 marketing and advertising data sources, spanning global ad networks, ecommerce platforms, web analytics engines, and customer relationship management systems.
Unlike generic data integration tools that treat marketing tables like arbitrary database rows, Supermetrics understands domain-specific data structures. The connector engine recognizes how impressions, clicks, conversions, video completion rates, and purchase values interact across different attribution windows.
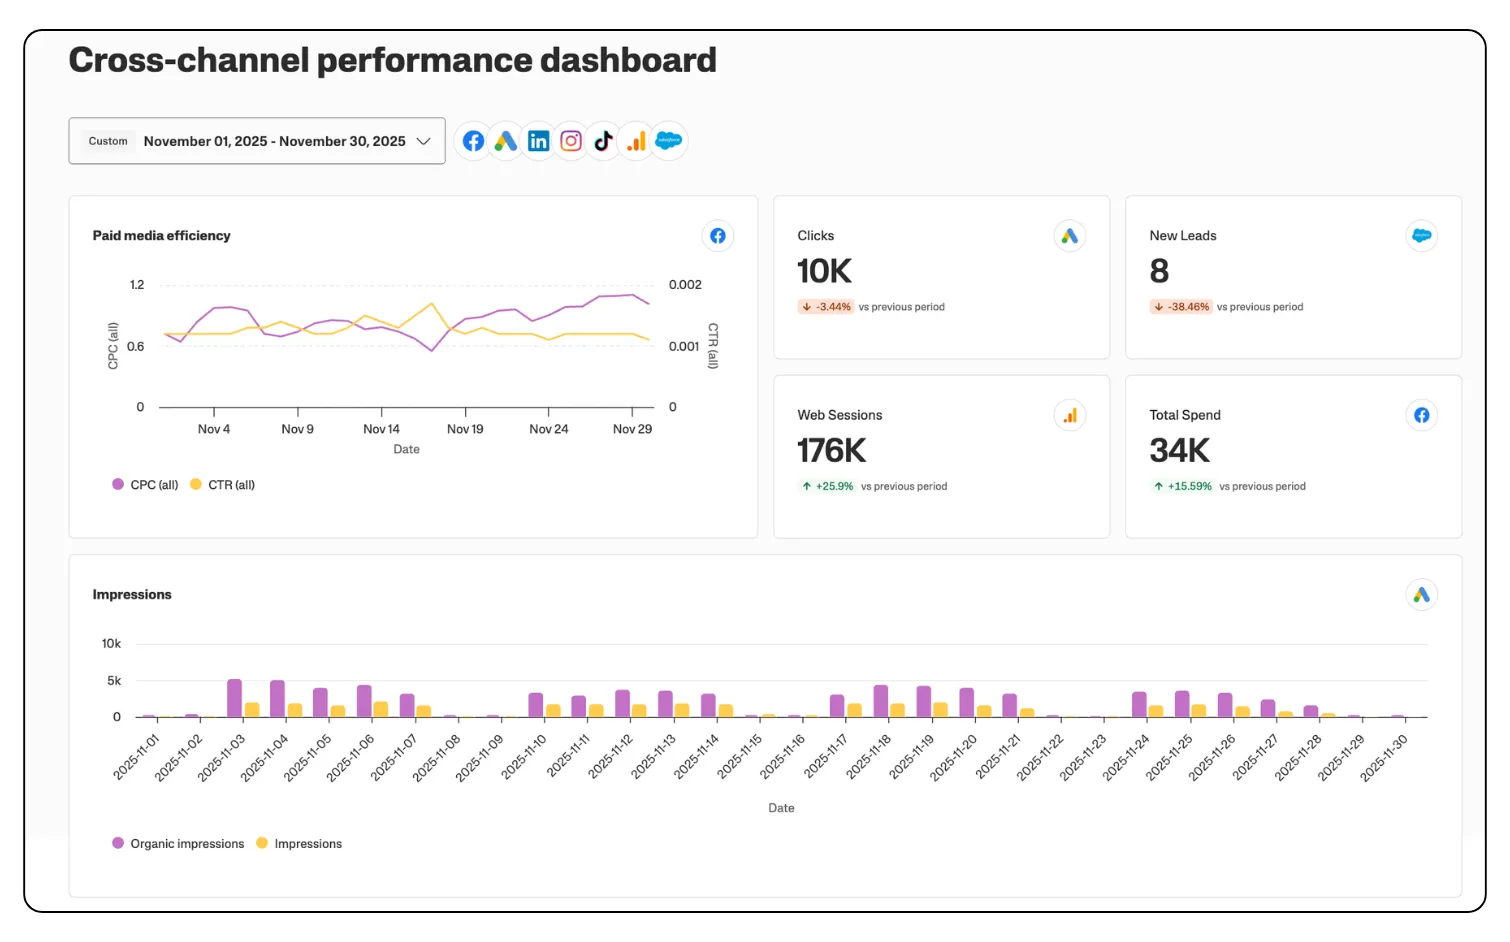 Supermetrics centralized data overview illustrating multi-channel performance aggregation
Upstream advertising networks modify their schemas frequently. When Meta updates its Graph API or Google Analytics deprecates custom dimensions, internal custom integration scripts break immediately.
Supermetrics isolates marketers from upstream volatility through automated schema normalization. Dedicated engineering teams update underlying endpoint mappings centrally, allowing scheduled customer queries to pull metrics seamlessly without manual maintenance.
| Data Source Category | Primary Supported Platforms | Available Metrics and Dimensions |
|---|---|---|
| Paid Search & Social | Google Ads, Meta Ads, TikTok Ads, LinkedIn Ads, Pinterest Ads | Impressions, CPM, CPC, ROAS, granular campaign splits |
| Analytics & Attribution | Google Analytics 4, Adobe Analytics, Matomo | Active sessions, bounce rates, custom event parameters |
| Ecommerce & Sales | Shopify, WooCommerce, Amazon Advertising, Stripe | Order count, gross revenue, refund volume, SKU performance |
| CRM & Pipeline | HubSpot, Salesforce, Klaviyo, Mailchimp | Lead lifecycle status, deal stage velocity, contact interactions |
Marketers can also define custom calculated fields directly inside the query interface. If an organization measures blended customer acquisition costs by combining Facebook spend with Google search spend, Supermetrics computes that ratio dynamically before loading values into destination tables.
Authentication token management runs continuously in the background. The platform maintains OAuth tokens securely, refreshing expired access credentials automatically to prevent scheduled morning reports from failing.
In multi-region environments, the connector engine handles multi-currency conversions automatically. When an international brand operates advertising accounts across North America, Europe, and Asia, Supermetrics converts localized expenditures into a standardized corporate reporting currency.
Historical backfilling represents another critical architectural capability. When onboarding a new client, marketing agencies can trigger backfill queries spanning thirty-six months of historical ad spend, providing instant context for seasonal trend forecasting.
Attribution window alignment poses another significant challenge for cross-channel measurement. Meta Ads frequently defaults to a 7-day click and 1-day view attribution window, whereas Google Ads emphasizes last-click interactions. Supermetrics preserves underlying conversion timestamps, allowing data teams to normalize conflicting attribution models inside downstream reporting tables.
The connector suite also provides native compatibility with modern privacy frameworks. Following industry-wide adoption of Apple App Tracking Transparency and Google Consent Mode v2, standard analytics tags often miss conversion events. Supermetrics captures server-side conversion signals and modeled conversions, ensuring dashboards reflect accurate revenue attribution without violating consumer privacy regulations.
3. Spreadsheet Automation Across Google Sheets and Excel
Spreadsheets remain the universal analysis canvas for growth marketing professionals. Regardless of how sophisticated modern cloud Business Intelligence (BI) platforms become, analysts continue returning to Google Sheets and Microsoft Excel for flexible ad-hoc financial modeling.
Supermetrics for Google Sheets operates through a dedicated sidebar extension. Analysts launch the sidebar directly inside their workbook to configure data sources, choose target accounts, select date ranges, and specify dimensions without leaving their active spreadsheet.
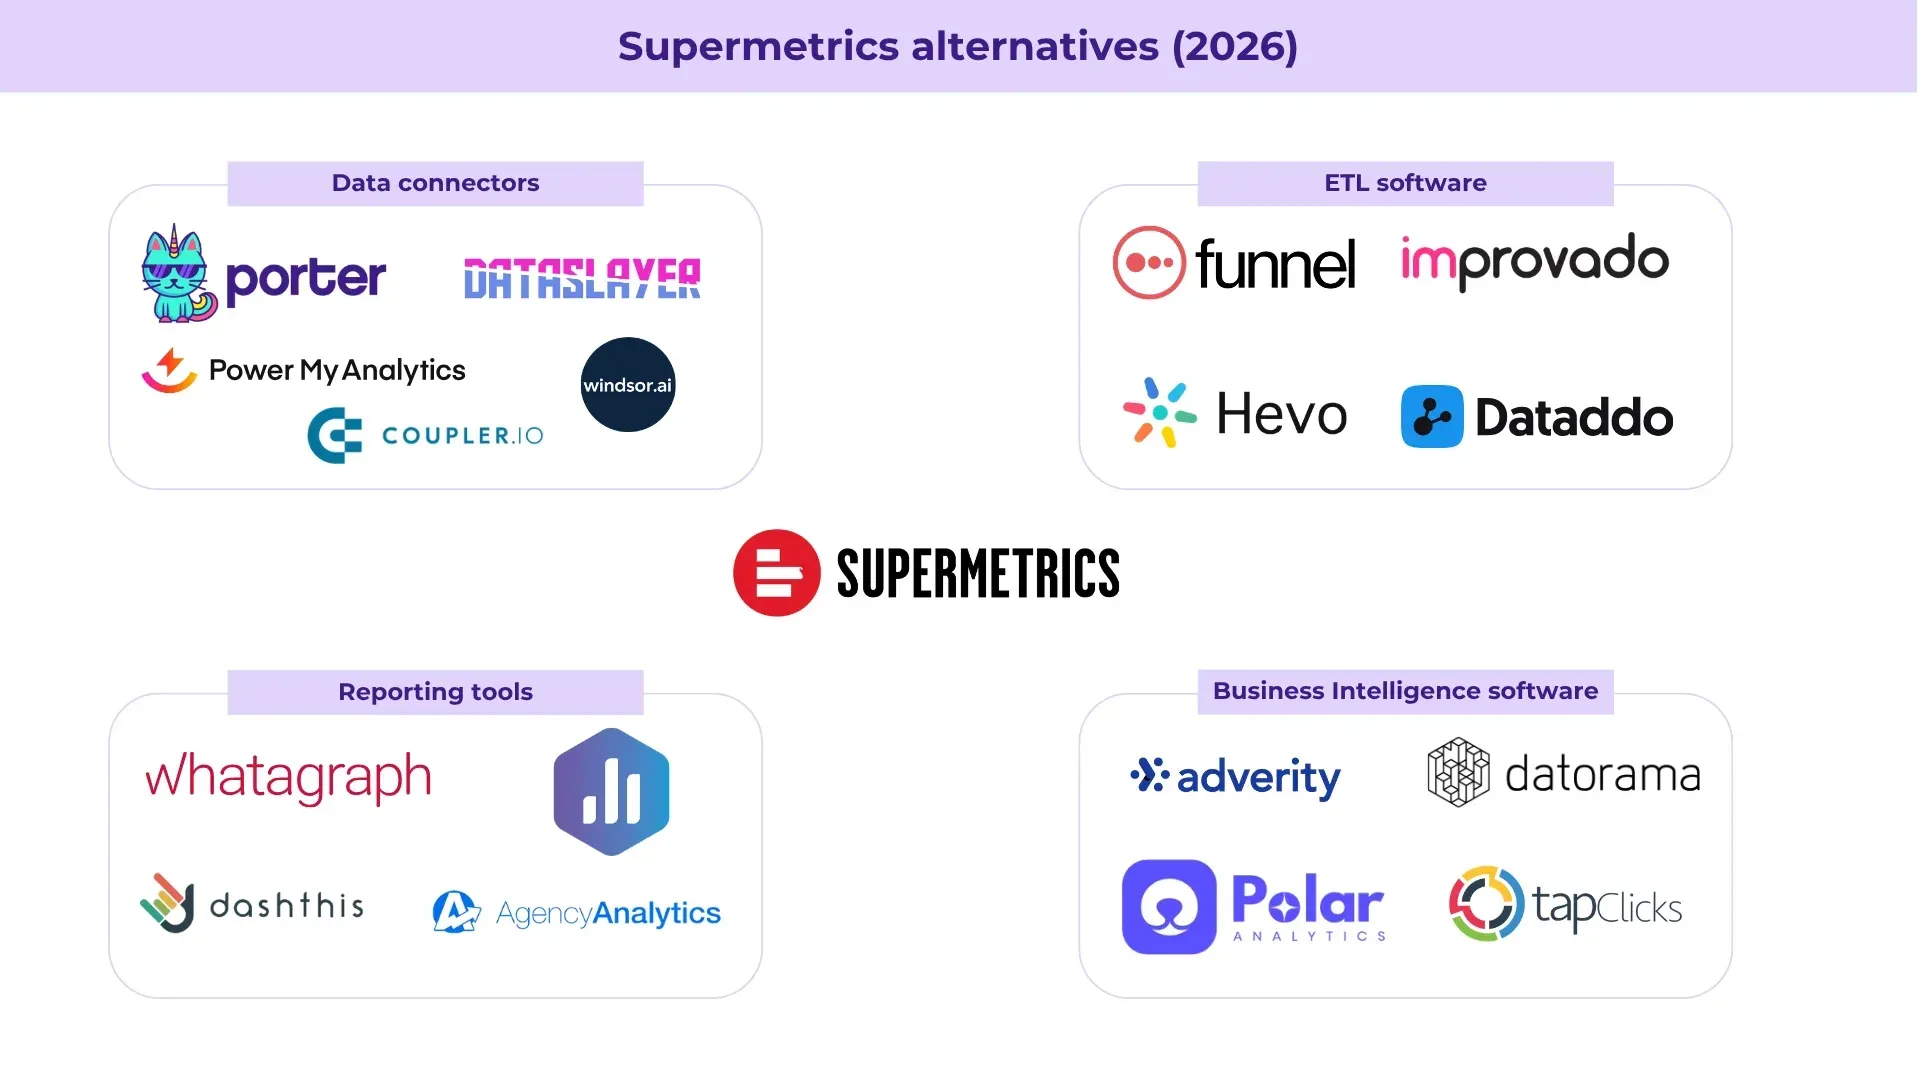 Supermetrics connector library displaying supported marketing platforms and destinations
The real power of the spreadsheet connector emerges from scheduled automated refreshes. Teams configure daily, weekly, or hourly triggers that pull fresh campaign figures overnight while staff sleep.
When marketing directors open their budget tracking workbooks at eight in the morning, every spend row displays verified yesterday performance. This automated rhythm saves up to 90% of manual reporting time, transforming static workbooks into live operational dashboards through disciplined query design principles:
- Dedicated Raw Data Tabs: Maintain pure, unformatted Supermetrics query outputs on hidden raw tabs to isolate automated updates from visual formatting.
- Dynamic Range Referencing: Point presentation summary tabs to raw data ranges using structured lookups and pivot calculations.
- Partitioned Query Schedules: Stagger automated refresh times across early morning hours to avoid simultaneous sheet recalculation bottlenecks.
- Error Alert Webhooks: Configure email notifications that trigger immediately if a specific ad account fails to return expected rows during scheduled syncs.
Organizations that maintain customer records in structured relational storage in Airtable can combine spreadsheet outputs with operational databases to build comprehensive customer lifetime value models. Combining ad spend data with operational fulfillment tables reveals true net margin per acquired customer.
Complex spreadsheet models often suffer from performance degradation when workbook sizes expand. Supermetrics mitigates workbook bloat by allowing analysts to aggregate metrics during the initial query stage, preventing unnecessary row-level records from consuming spreadsheet memory limits.
Analysts can duplicate complete spreadsheet dashboards across new client workspaces in minutes. Updating account IDs in a centralized control cell allows all underlying Supermetrics queries to refresh with new client data instantly.
Spreadsheet governance features help agencies protect intellectual property across distributed teams. Administrators can lock underlying query definitions, preventing accidental modifications while still permitting junior analysts to view and filter refreshed performance metrics. Audit trails document which team member triggered manual data refreshes or adjusted metric selections, ensuring strict operational accountability.
4. Business Intelligence Delivery Through Looker Studio and Power BI
While spreadsheets serve internal analytical modeling, presenting performance data to clients and company executives requires polished visual dashboards. Supermetrics functions as an essential Google Looker Studio partner, offering specialized Community Connectors that stream data directly into Google visual canvases.
Connecting Looker Studio to ad platforms through native free connectors often creates performance bottlenecks. Free connectors frequently time out when querying large date ranges or multi-account agency portfolios.
Supermetrics Community Connectors optimize query payloads through intelligent batching and client-side aggregation. Dashboards load faster, scorecards refresh reliably, and date range comparison controls function smoothly even across multi-year historical datasets.
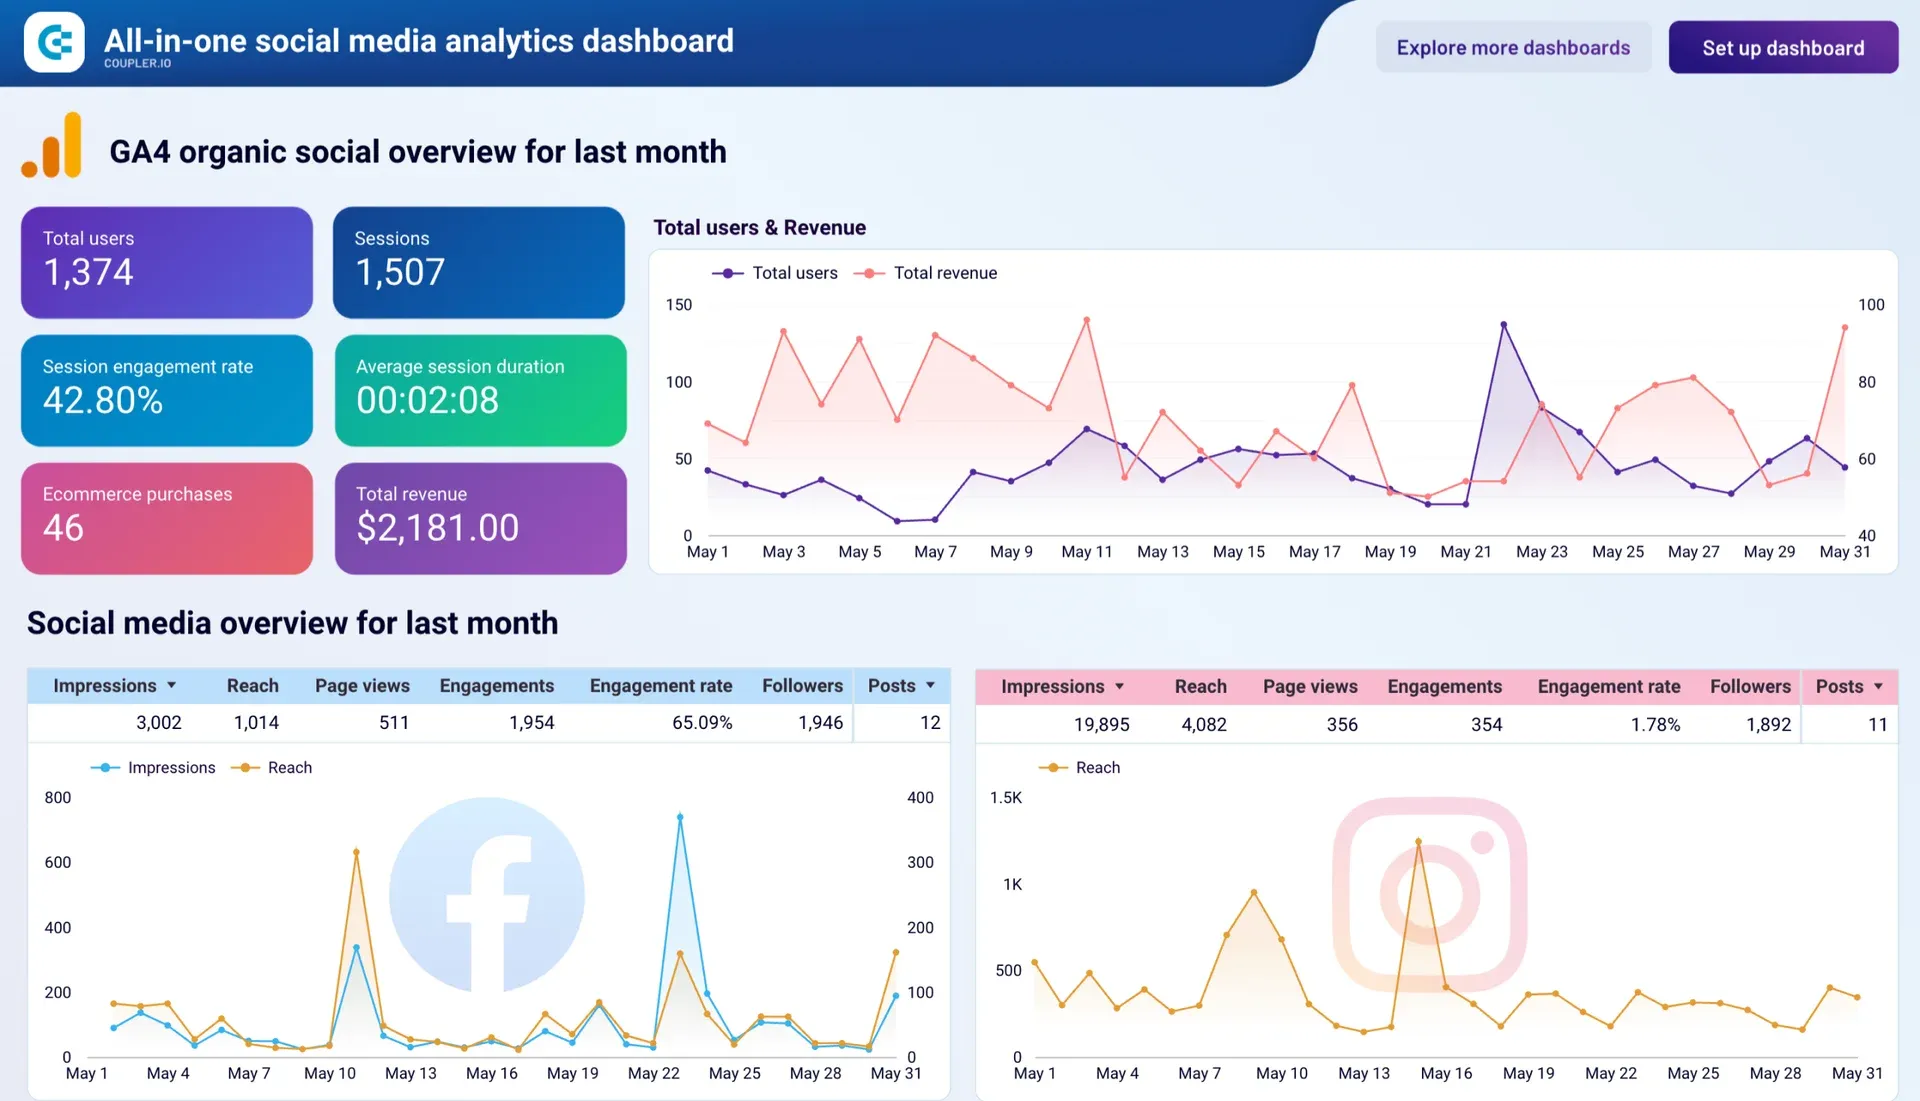 Supermetrics Looker Studio performance dashboard showing cross-network advertising analytics
Agencies managing dozens of distinct client accounts benefit from unified multi-account connectors. Instead of creating twenty separate dashboard pages for twenty different Facebook ad accounts, analysts construct a single master template with a dynamic account picker dropdown.
Looker Studio dashboards also handle currency conversions natively. When global brands run campaigns across US Dollars, Euros, and British Pounds, Supermetrics standardizes values into a uniform reporting currency using daily spot exchange rates.
Organizations should account for Google enterprise licensing when deploying Looker Studio at scale. While basic Looker Studio remains free, enterprise environments requiring organizational governance must license Google Looker Studio Pro at $9 per user per project monthly directly from Google.
Teams using Microsoft analytics ecosystems can deploy the Supermetrics Power BI connector. This connector streams normalized marketing figures directly into Microsoft Power Query, integrating campaign spend with enterprise resource planning systems.
Visual styling in Looker Studio pairs seamlessly with custom client branding. Agencies embed client logos, brand color palettes, and custom typography, delivering executive-ready reports that look like proprietary software portals.
Interactive date filters empower clients to explore their own data safely. Stakeholders examine weekly trends or compare quarter-over-quarter growth without risking accidental formula deletion on live production sheets.
Data blending inside Looker Studio becomes significantly more reliable when powered by Supermetrics. Standard native Google connectors often drop records when joining Google Ads spend with Facebook campaign metrics due to mismatched date formatting or casing differences. Supermetrics standardizes campaign naming conventions and date structures upfront, enabling clean cross-channel blend operations without complex regex formulas.
Agencies can also deploy automated scheduled email reports directly from Looker Studio. Client executives receive weekly PDF performance summaries in their inboxes every Monday morning, complete with high-level scorecards and annotated commentary explaining significant performance shifts.
5. Enterprise Data Warehouse Ingestion for BigQuery and Snowflake
As growth organizations mature, spreadsheet storage limits and Looker Studio query quotas become operational bottlenecks. High-growth ecommerce brands and enterprise software companies generate millions of granular conversion rows that overwhelm standard desktop workbooks.
For these data-mature organizations, Supermetrics offers enterprise data warehouse pipelines. The system streams marketing data directly into Google BigQuery, Snowflake, and Amazon Redshift on automated hourly or daily schedules.
Warehouse pipelines eliminate the manual query building required in spreadsheet sidebars. Data engineers configure centralized ingestion jobs inside the Supermetrics cloud console, defining target destination datasets, partition keys, and historical backfill ranges.
| Warehouse Feature | Spreadsheet Connector | BigQuery & Snowflake Pipeline |
|---|---|---|
| Historical Data Retention | Constrained by sheet cell limits (up to 10M cells) | Unlimited historical storage with full row granularity |
| Query Execution Velocity | Bound by desktop browser memory and sheet recalculation | Massively parallel SQL processing in milliseconds |
| Cross-Department Joins | Fragile formulas prone to manual editing breakage | Production SQL joins with CRM and ERP database tables |
| Automated Backfills | Manual date range query reruns | Turnkey historical backfills spanning multi-year archives |
Connecting advertising spend with native CRM pipelines in HubSpot inside BigQuery unlocks true closed-loop revenue attribution. Analysts write SQL models that match early ad clicks with final closed enterprise contracts signed six months later.
Automated schema evolution ensures that when ad platforms add new metrics, Supermetrics creates corresponding columns inside destination warehouse tables automatically. Data engineering teams avoid building custom Airflow DAGs merely to ingest standard advertising endpoints.
Partitioning strategies within BigQuery reduce cloud query expenses significantly. Supermetrics partitions destination tables by ingestion date, allowing downstream dbt models to process incremental daily updates without scanning multi-terabyte table histories.
Enterprise teams maintain complete ownership of their raw data warehouse tables. If an organization terminates its Supermetrics agreement, historical marketing tables remain permanently accessible inside their corporate cloud environment.
Data transformation tools like dbt integrate naturally with Supermetrics warehouse schemas. Analytics engineers construct modular staging models that cast data types, filter out internal test traffic, and apply business logic rules before surfacing metrics in executive dashboards. Maintaining raw ingestion tables separately from transformed reporting views ensures complete data lineage transparency during corporate financial audits.
Modern marketing teams also use reverse ETL platforms to push warehouse metrics back into advertising networks. Feeding offline conversion values and customer lifetime value scores back into Google Ads and Meta Conversions API allows bidding algorithms to optimize for high-margin customers rather than raw lead volume.
6. API Throttling Resilience Under High Concurrency
Advertising networks enforce strict rate limits on their programmatic endpoints to protect cloud infrastructure from abusive automated traffic. When thousands of global marketing agencies schedule daily reporting queries at midnight, ad platform servers experience severe network congestion.
Supermetrics mitigates rate limit throttling through proprietary request queuing and exponential backoff retry algorithms. When an ad network returns a temporary HTTP 429 status code indicating rate limit exhaustion, the Supermetrics execution engine pauses execution. The system triggers 5 automatic retry attempts across a calibrated 60 seconds backoff window, spacing out requests until the host endpoint accepts incoming payloads.
This automated resilience proves critical during month-end accounting reconciliations. The pipeline absorbs brief vendor outages gracefully, logging detailed error codes rather than crashing user workbooks silently.
Dedicated platform monitoring infrastructure tracks uptime across all supported third-party APIs around the clock. If Meta or Google Ads experiences an undocumented global outage, Supermetrics posts real-time incident reports, keeping marketing teams informed while upstream engineers resolve network disruptions.
7. Connector Tiering Against Total Subscription Economics
Supermetrics structures its commercial licensing around a destination-based pricing model. Customers choose a primary reporting destination like Google Sheets or Looker Studio rather than paying for raw row counts. Understanding this architecture is critical for budgeting software expenses accurately across growing marketing departments.
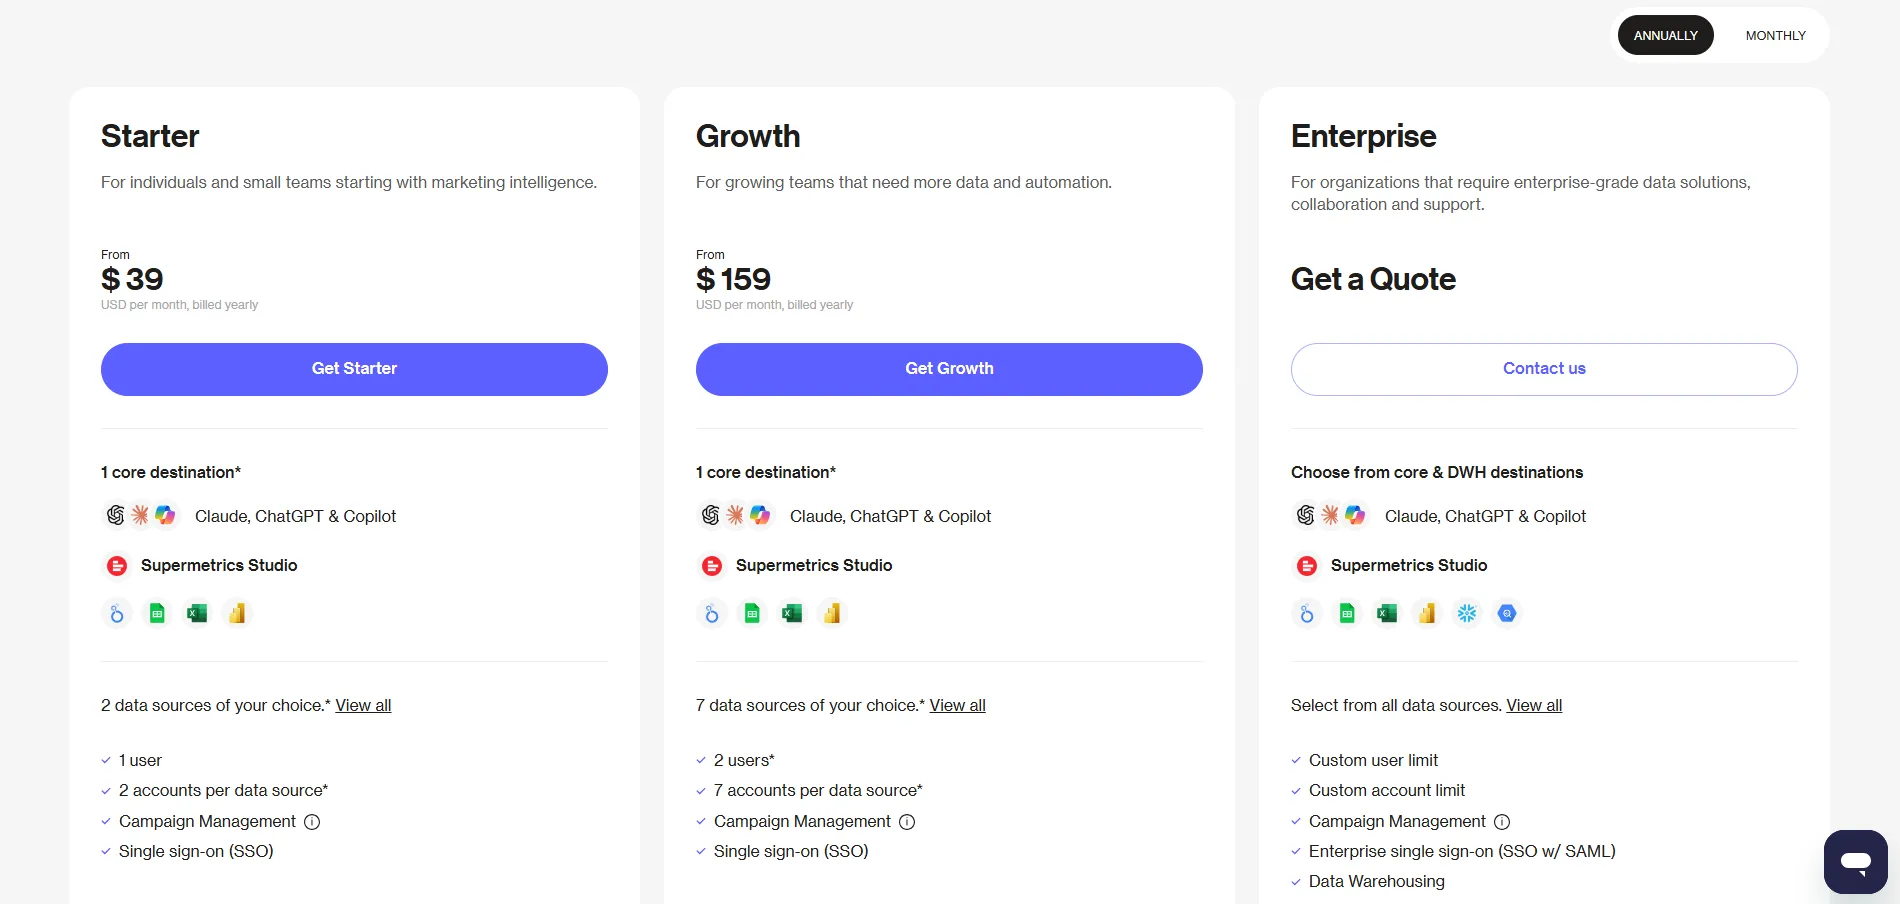 Supermetrics subscription comparison showing tiers, included connectors, and destination limits
The entry Starter plan starts at $39 per month billed annually (or $44 monthly). This tier includes one core destination, allows access to two or three select data sources, and restricts usage to a single user managing a limited number of ad accounts.
| Supermetrics Pricing Tier | Annual Monthly Price | Core Destinations Included | Included Data Sources | Target Marketing Audience |
|---|---|---|---|---|
| Starter Tier | $39 per month | 1 core destination | 2 to 3 data sources | Freelance marketers and solo consultants managing single brands |
| Growth Tier | $159 per month | 1 core destination | 6 to 7 data sources | Scaling in-house teams requiring multi-channel performance data |
| Enterprise Custom | Custom quote | Multiple destinations | Custom enterprise catalog | Agencies and large enterprises streaming to BigQuery or Snowflake |
The Growth plan costs $159 per month billed annually (or $177 monthly), expanding coverage to six or seven data sources and providing two team user seats with higher account caps.
The most critical licensing constraint involves multiple destinations. If an agency requires Looker Studio for visual client presentation decks and Google Sheets for financial modeling, they cannot run both on a single base plan. Adding a secondary destination incurs an additional fee starting at $49 monthly per destination.
Agencies with extensive client rosters should evaluate custom enterprise agreements. Custom contracts unlock unlimited connected ad accounts, dedicated account manager support, and high-volume data warehouse ingestion pipelines.
Annual payment terms deliver substantial discounts compared to month-to-month billing. Growing teams should estimate their connector requirements twelve months in advance to avoid unexpected mid-contract plan upgrades.
Consider an agency managing ten distinct client ad accounts across Meta Ads, Google Ads, and LinkedIn Ads. On the Growth plan, connecting ten ad accounts per network requires purchasing account add-on packs, increasing the effective monthly commitment beyond the base subscription. Financial directors must model total software licensing costs against saved analyst hours to confirm positive return on investment.
Despite these incremental add-on charges, the software economics remain favorable compared to custom development. Hiring full-time data engineers to maintain custom Python pipelines incurs substantial annual payroll costs. A managed Supermetrics deployment eliminates that technical maintenance burden at a fraction of in-house expenses.
8. Supermetrics Core Strengths and Advantages
Data pipeline reliability often determines whether an integration layer survives sudden upstream API schema migrations. With over 800 verified marketing analytics reviews on G2 averaging 4.4 out of 5 stars, Supermetrics earns industry respect for connector resilience and pipeline dependability.
Core Architectural Strengths
- Connector Ecosystem Breadth: Turnkey access to over 150 advertising and analytics platforms eliminates custom script authoring.
- Automated Upstream Maintenance: Centralized schema mapping absorbs frequent third-party API changes without breaking customer dashboards.
- Turnkey Spreadsheet Ergonomics: Intuitive Google Sheets and Excel sidebars allow non-technical marketers to construct powerful automated reports.
- Enterprise Warehouse Scalability: Seamless transitions from lightweight spreadsheets to Google BigQuery and Snowflake support long-term corporate growth.
Comparing Supermetrics against competing integration approaches clarifies platform boundaries across 4 operational dimensions:
| Integration Approach | Supermetrics Managed Pipeline | Custom Python ETL Scripts | Generic Cloud Connectors (Fivetran) |
|---|---|---|---|
| Initial Deployment Speed | Live data in under 15 minutes | Several weeks of engineering setup | Fast warehouse setup, no spreadsheet sidebar |
| Upstream Schema Updates | Handled automatically by vendor | Requires manual developer maintenance | Handled automatically for warehouse targets |
| Business Logic Understanding | Deep native marketing metrics | Must be defined manually in code | Generic database tables without marketing formulas |
| Total Cost of Ownership | Predictable SaaS subscription | High internal developer salary costs | Expensive row-based usage pricing models |
Building an in-house data pipeline using Python scripts grants total control over code logic. However, engineering teams must maintain authentication credentials, monitor API version sunsets, and fix broken pipelines whenever ad networks deploy breaking updates. Supermetrics replaces that technical burden with managed reliability.
Growth teams that prioritize timely reporting and actionable campaign optimization find the platform delivers significant operational leverage. Delivering reliable, automated weekly reporting packages improves client retention rates and builds organizational trust. Agency operations managers often underestimate the hidden costs of manual reporting errors.
When an analyst accidentally transposes numbers or miscalculates return on ad spend during manual spreadsheet assembly, client trust erodes quickly. Automated pipelines eliminate human transposition errors entirely, ensuring that every published figure traces directly back to raw ad network APIs. Standardized templates also accelerate team onboarding across distributed marketing agencies.
Rather than teaching junior media buyers how to navigate ten disparate advertising dashboards to compile performance reports, agencies provide preconfigured Google Sheets and Looker Studio canvases that populate automatically. This turnkey distribution model allows newly hired analysts to produce client-ready performance deliverables on their first working day.
9. Supermetrics Operational Limitations and Drawbacks
While Supermetrics delivers robust data transport across mainstream marketing channels, several architectural constraints and commercial policies introduce friction for scaling organizations. Understanding these boundaries allows operations directors to plan infrastructure budgets accurately.
Practical Operational Constraints
- Single Destination Restrictions: Base licenses lock usage strictly to one destination, requiring supplementary $49 monthly add-ons for multi-tool workflows.
- Account Threshold Caps: Entry-level plans penalize growing agencies with strict caps on connected ad accounts per platform.
- Upstream Rate Dependencies: Network rate limits from advertising platforms can delay scheduled refreshes during peak traffic windows.
The single-destination restriction represents the most common operational friction point. Many growth teams naturally begin by querying data into Google Sheets for quick ad-hoc analysis, but subsequently want to visualize those same campaign metrics inside Looker Studio client dashboards. Under base tier licensing, running both workflows simultaneously requires purchasing a destination add-on at $49 per month or upgrading to higher subscription tiers.
Account threshold limits on entry-level plans also constrain agencies managing diverse client portfolios. Connecting more than five or ten ad accounts per network requires purchasing account add-on packs, which steadily escalates total subscription expenditure. Because Supermetrics relies on public ad platform APIs, first-of-month reporting runs can encounter upstream throttling from Meta or Google when thousands of advertisers query historical performance simultaneously.
Despite these licensing and rate limitations, the software economics remain favorable compared to custom development. Hiring full-time data engineers to maintain custom Python pipelines incurs substantial annual payroll costs. A managed Supermetrics deployment eliminates that technical maintenance burden at a fraction of in-house expenses.
What We Liked (Pros)
- Automates recurring data pulls across 150 advertising and analytics sources reliably
- Eliminates manual CSV downloads while cutting monthly reporting workloads by 90 percent
- Maintains deep schema normalization across constantly evolving ad platform endpoints
- Integrates smoothly into Looker Studio dashboards and collaborative Google Sheets workflows
Areas for Improvement (Cons)
- Base subscription plans restrict usage strictly to a single reporting destination
- Additional reporting destinations require supplementary monthly fees starting at $49
- Aggressive account limits on entry tiers penalize agencies managing multiple client brands
10. Frequently Asked Questions About Supermetrics
Supermetrics operates as an automated marketing data pipeline that extracts metrics from ad platforms and loads them directly into spreadsheets, business intelligence dashboards, or data warehouses.
No. Supermetrics packages its licenses around single core destinations, requiring teams to pay a $49 monthly add-on fee to stream data into a second destination.
Supermetrics engineering teams monitor ad network updates, updating connector schemas centrally so user queries continue executing without manual script modifications.
Supermetrics operates primarily as an in-flight pipeline, routing data directly from the source network into your destination without storing persistent data copies on its servers.
First-of-month traffic spikes can trigger upstream rate limits from ad networks like Meta, causing temporary query timeouts that resolve once request volume normalizes.
While custom code avoids subscription fees, Supermetrics eliminates the continuous maintenance burden of authentication token rotation, API deprecations, and schema drift.
11. Final Editorial Verdict on Supermetrics
Supermetrics holds an enduring position as the definitive data transport engine for modern performance marketing. Reliability remains its hallmark. The platform shields analysts from breaking API schema updates while eliminating manual CSV exports to deliver audit-ready business intelligence.
The platform provides exceptional ergonomic value for growth marketers and performance agencies who live inside Google Sheets and Looker Studio. The ability to schedule automated overnight refreshes ensures that client discussions always center on fresh, verified performance data rather than outdated estimates.
While the single-destination pricing constraint and account caps require careful budget planning, the operational hours saved justify the software investment for data-driven teams. For agencies, e-commerce brands, and marketing departments looking to scale reporting without adding technical engineering overhead, Supermetrics earns our strong editorial recommendation.


Supermetrics
Supermetrics remains the industry benchmark for automated marketing reporting, delivering reliable connectors for agencies and growth teams despite restrictive destination licensing.