




1. Why Digital Experience Analytics Demands Tagless Behavioral Telemetry
Evaluating software investments starts with a rigorous Contentsquare review that examines real-world architecture rather than sales collateral. Standard web analytics frameworks record aggregate metrics like pageviews, bounce rates, and traffic referrers, yet they remain blind to why individual visitors abandon purchase funnels. Engineering teams traditionally spend weeks writing custom tracking scripts to capture button clicks, modal views, and form field entries.
Digital Experience Analytics (DXA) solves this structural operational drag by decoupling behavioral measurement from manual code instrumentation. A single asynchronous script weighing under 50 KB compressed runs in the browser background. Digital teams monitor user actions across desktop viewports, mobile screens, and native applications without touching source files.
When engineering teams refactor frontends or rename Document Object Model (DOM) elements, legacy analytics tools silently stop recording interactions. Contentsquare maintains telemetry continuity because its event listener captures element hierarchies dynamically. Changes to CSS classes or parent container nodes do not corrupt retroactive behavioral histories.
The platform serves over 3,000 enterprise brands and tracks interactions across 1.3+ million websites globally. Strategic corporate acquisitions have broadened its foundational data architecture. Contentsquare acquired Hotjar in September 2021 for qualitative surveys, followed by Heap in December 2023 for retroactive event tracking.
Client browsers collect interaction coordinates continuously without degrading visual performance. Telemetry beacons batch user interactions periodically every 5 seconds before dispatching lightweight payloads to regional ingestion clusters. This queued architecture prevents network congestion, ensuring browser threads render layout changes smoothly while dynamic DOM mutations register instantly.
Modern digital growth teams cannot afford weeks of manual tag deployment. Traditional analytics suites force developers to anticipate every user behavior before writing code, whereas tagless engines capture every interaction retroactively:
| Architectural Dimension | Traditional Web Analytics | Contentsquare DXA Platform |
|---|---|---|
| Event Instrumentation | Manual tag configuration via GTM or custom code | Automatic client-side telemetry capture |
| Data Retroactivity | Forward-looking only; untagged events are permanently lost | Fully retroactive across all captured DOM interactions |
| Financial Valuation | Goal conversion totals without element attribution | Direct dollar revenue attribution per interface zone |
| Performance Impact | Multiple third-party tracking scripts competing for main thread | Single CDN script loading asynchronously under 50 KB gzip |
Raw behavioral events stream into real-time aggregation pipelines. Business intelligence teams query historical user sessions immediately, bypassing manual database schema migrations.
2. Zone-Based Heatmaps and Revenue Attribution Mechanics
Traditional heatmap software produces static color overlays representing aggregate mouse clicks and cursor scrolls. These graphic representations look visually appealing, but they fail to connect user behavior with corporate financial outcomes. Marketing executives cannot determine whether an attractive homepage hero banner actually drove shopping cart additions or merely distracted high-intent customers from converting.
Contentsquare resolves this limitation through zone-based analysis (Zoning). The software parses web layouts into dynamic functional containers, linking user interactions within each specific zone directly to transactional checkout data. Digital teams inspect click rate, conversion contribution, and gross revenue generated per interface element across defined visitor segments.
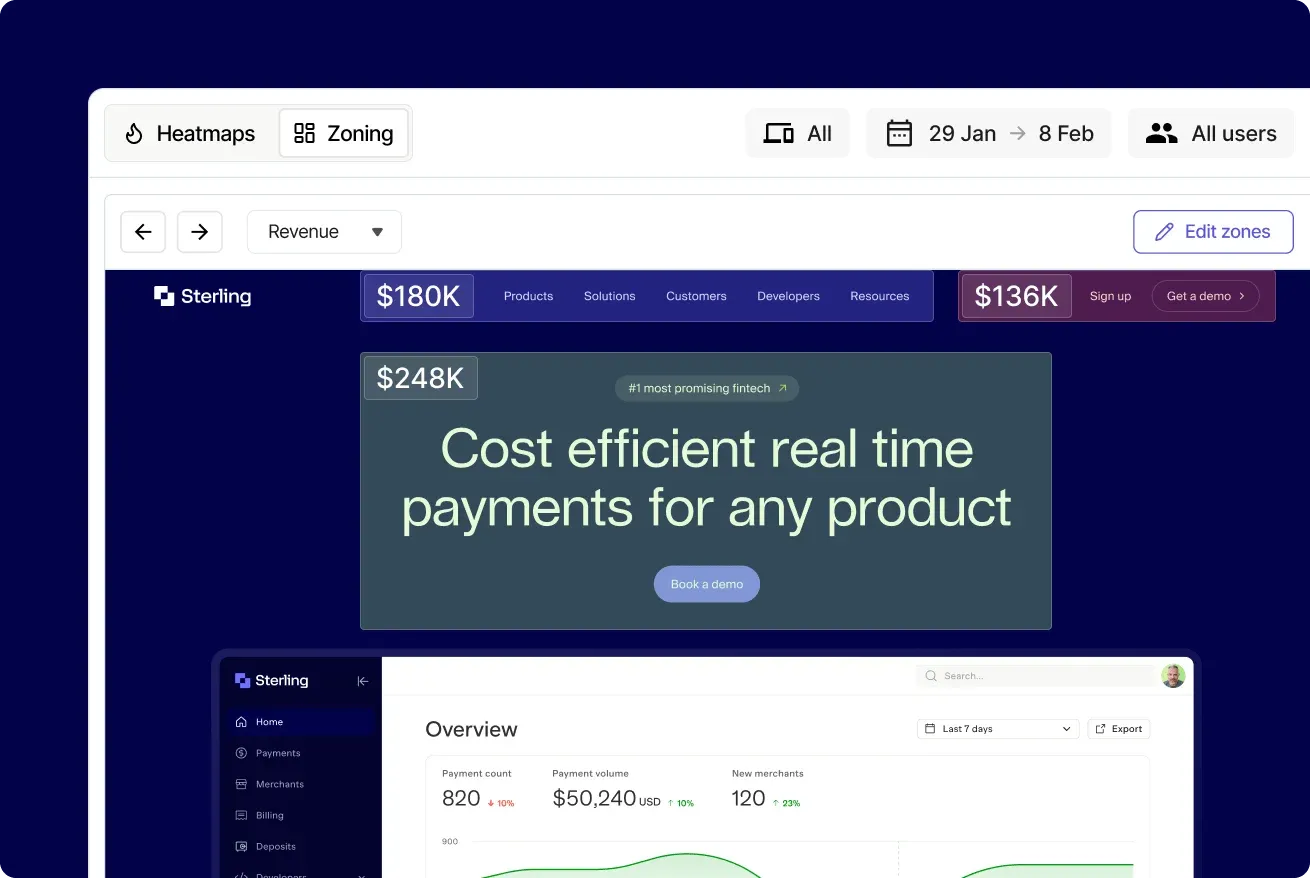 Zone-based heatmaps calculate exact revenue attribution and conversion impact across dynamic interface elements
The economic value of this approach becomes apparent during layout optimization. Automotive manufacturer Skoda utilized Contentsquare zoning metrics to restructure vehicle configuration pages, generating a 40% increase in test drive bookings. Instead of guessing how visual hierarchy impacted buyer motivation, their designers isolated specific form elements that caused friction.
Responsive web designs adjust layout geometry depending on screen dimensions. Contentsquare handles viewport variations seamlessly, recalculating zone boundaries across viewports from 375px mobile screens up to 1440px desktop displays. This fluid segmentation ensures merchandise banners receive accurate engagement metrics regardless of visitor hardware.
Analyzing interface performance relies on four mathematical indicators that guide product revisions across departments. Digital teams evaluate these metrics to prioritize high-impact layout experiments without relying on subjective designer opinions:
- Attractiveness Rate: Measures the percentage of visitors who clicked within a designated zone after viewing that page section.
- Conversion Contribution: Calculates the conversion rate of sessions where visitors engaged with the zone compared to sessions where they ignored it.
- Revenue per Click: Multiplies total transaction values by visitor engagement to display the tangible dollar yield of specific navigational elements.
- Hesitation Time: Measures the average elapsed seconds between a visitor hovering their cursor over a module and completing an intentional click.
These metrics integrate smoothly with ecommerce landing page builders like Replo, allowing online merchants to measure merchandise grid performance without maintaining manual event listeners. Teams run side-by-side comparisons of layout variations directly in the interface. Opening the CSQ Live browser extension lets growth managers view revenue figures floating above live site elements during executive reviews.
Evaluating seasonal redesigns requires benchmarking historical page layouts against current templates. The Page Comparator module displays dual viewport captures side by side, highlighting variations in scroll depth, zone engagement, and transactional yield between marketing campaigns. Merchandisers isolate which promotional hero units lifted conversion rates during high-velocity holiday retail periods.
3. Reconstructing User Frustration Through Session Replay and AI Summaries
Visual heatmaps identify where user attention concentrates, but diagnosing specific functional anomalies requires granular session replay. Contentsquare captures visual Document Object Model state changes, reconstructs user sessions, and reproduces browser rendering without recording sensitive Personal Identifiable Information (PII).
The platform maintains enterprise data privacy compliance by applying automatic on-device masking. Form fields containing credit card numbers, authentication passwords, and user addresses are scrambled locally before telemetry packets transmit to cloud ingestion servers. This client-side redaction ensures full compliance with GDPR and CCPA privacy mandates while upholding strict Payment Card Industry (PCI-DSS) security standards.
Efficient data transmission represents a vital component of session playback architecture. Proprietary differential algorithms compress recorded DOM states at roughly a 10 to 1 ratio, storing complex user interactions without straining server disk arrays. Compliance officers configure role-based access rules to audit sensitive administrative views across global operating teams.
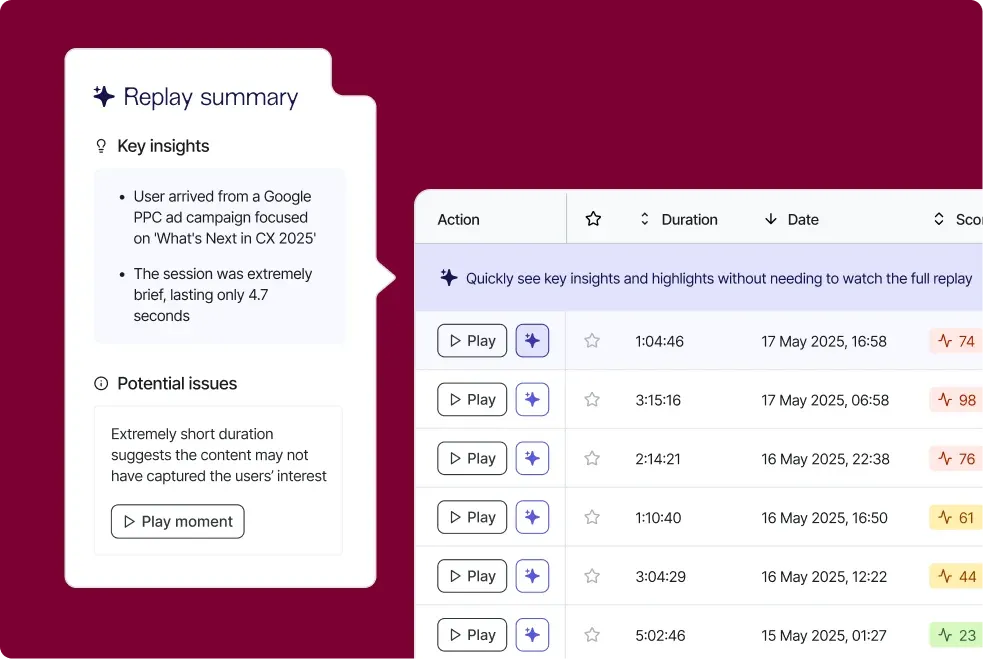 Session replay timeline isolates rage clicks, rapid scroll reversals, and API error states during user checkout journeys
Reconstructing thousands of individual video replays manually would paralyze product engineering teams. Contentsquare addresses this operational bottleneck by integrating automated frustration scoring and Sense AI session summaries. The platform categorizes behavioral signals into quantifiable friction patterns:
- Rage Clicking: Identifies instances where visitors click a dead or unresponsive interface element repeatedly within a two-second window.
- Scroll Reversals: Flags disoriented visitors who rapidly scroll up and down product pages searching for missing informational text.
- Looping Behaviors: Detects visitors who cycle through the same checkout screens repeatedly without completing payment.
- Form Field Hesitation: Highlights checkout inputs where users pause excessively or correct validation errors multiple times.
Sense AI processes these friction triggers to generate automated narrative summaries for each recorded session. Technical support engineers read bulleted incident reports rather than watching twenty-minute video playbacks, accelerating bug isolation across complex web applications. Session replay storage policies cap standard access at one to two months, prompting enterprise buyers to evaluate long-term retention add-ons for compliance audits.
4. Multi-Path Journey Analysis Across Modern Single-Page Applications
Understanding how customers traverse complex multi-step funnels represents a persistent challenge for digital product managers. Visitors rarely follow linear conversion paths designed by product designers. They branch into search filters, explore shipping policies, open secondary navigation menus, and loop back to original catalog categories.
Contentsquare Journey Analysis maps macro-level navigation flows through dynamic tree visualizations. The system aggregates millions of unique customer pathways into intuitive sunburst and node diagrams, highlighting unexpected loopbacks and primary exit corridors. Analyzing over 50 branching navigation paths simultaneously reveals hidden friction points that standard linear funnel tools obscure completely.
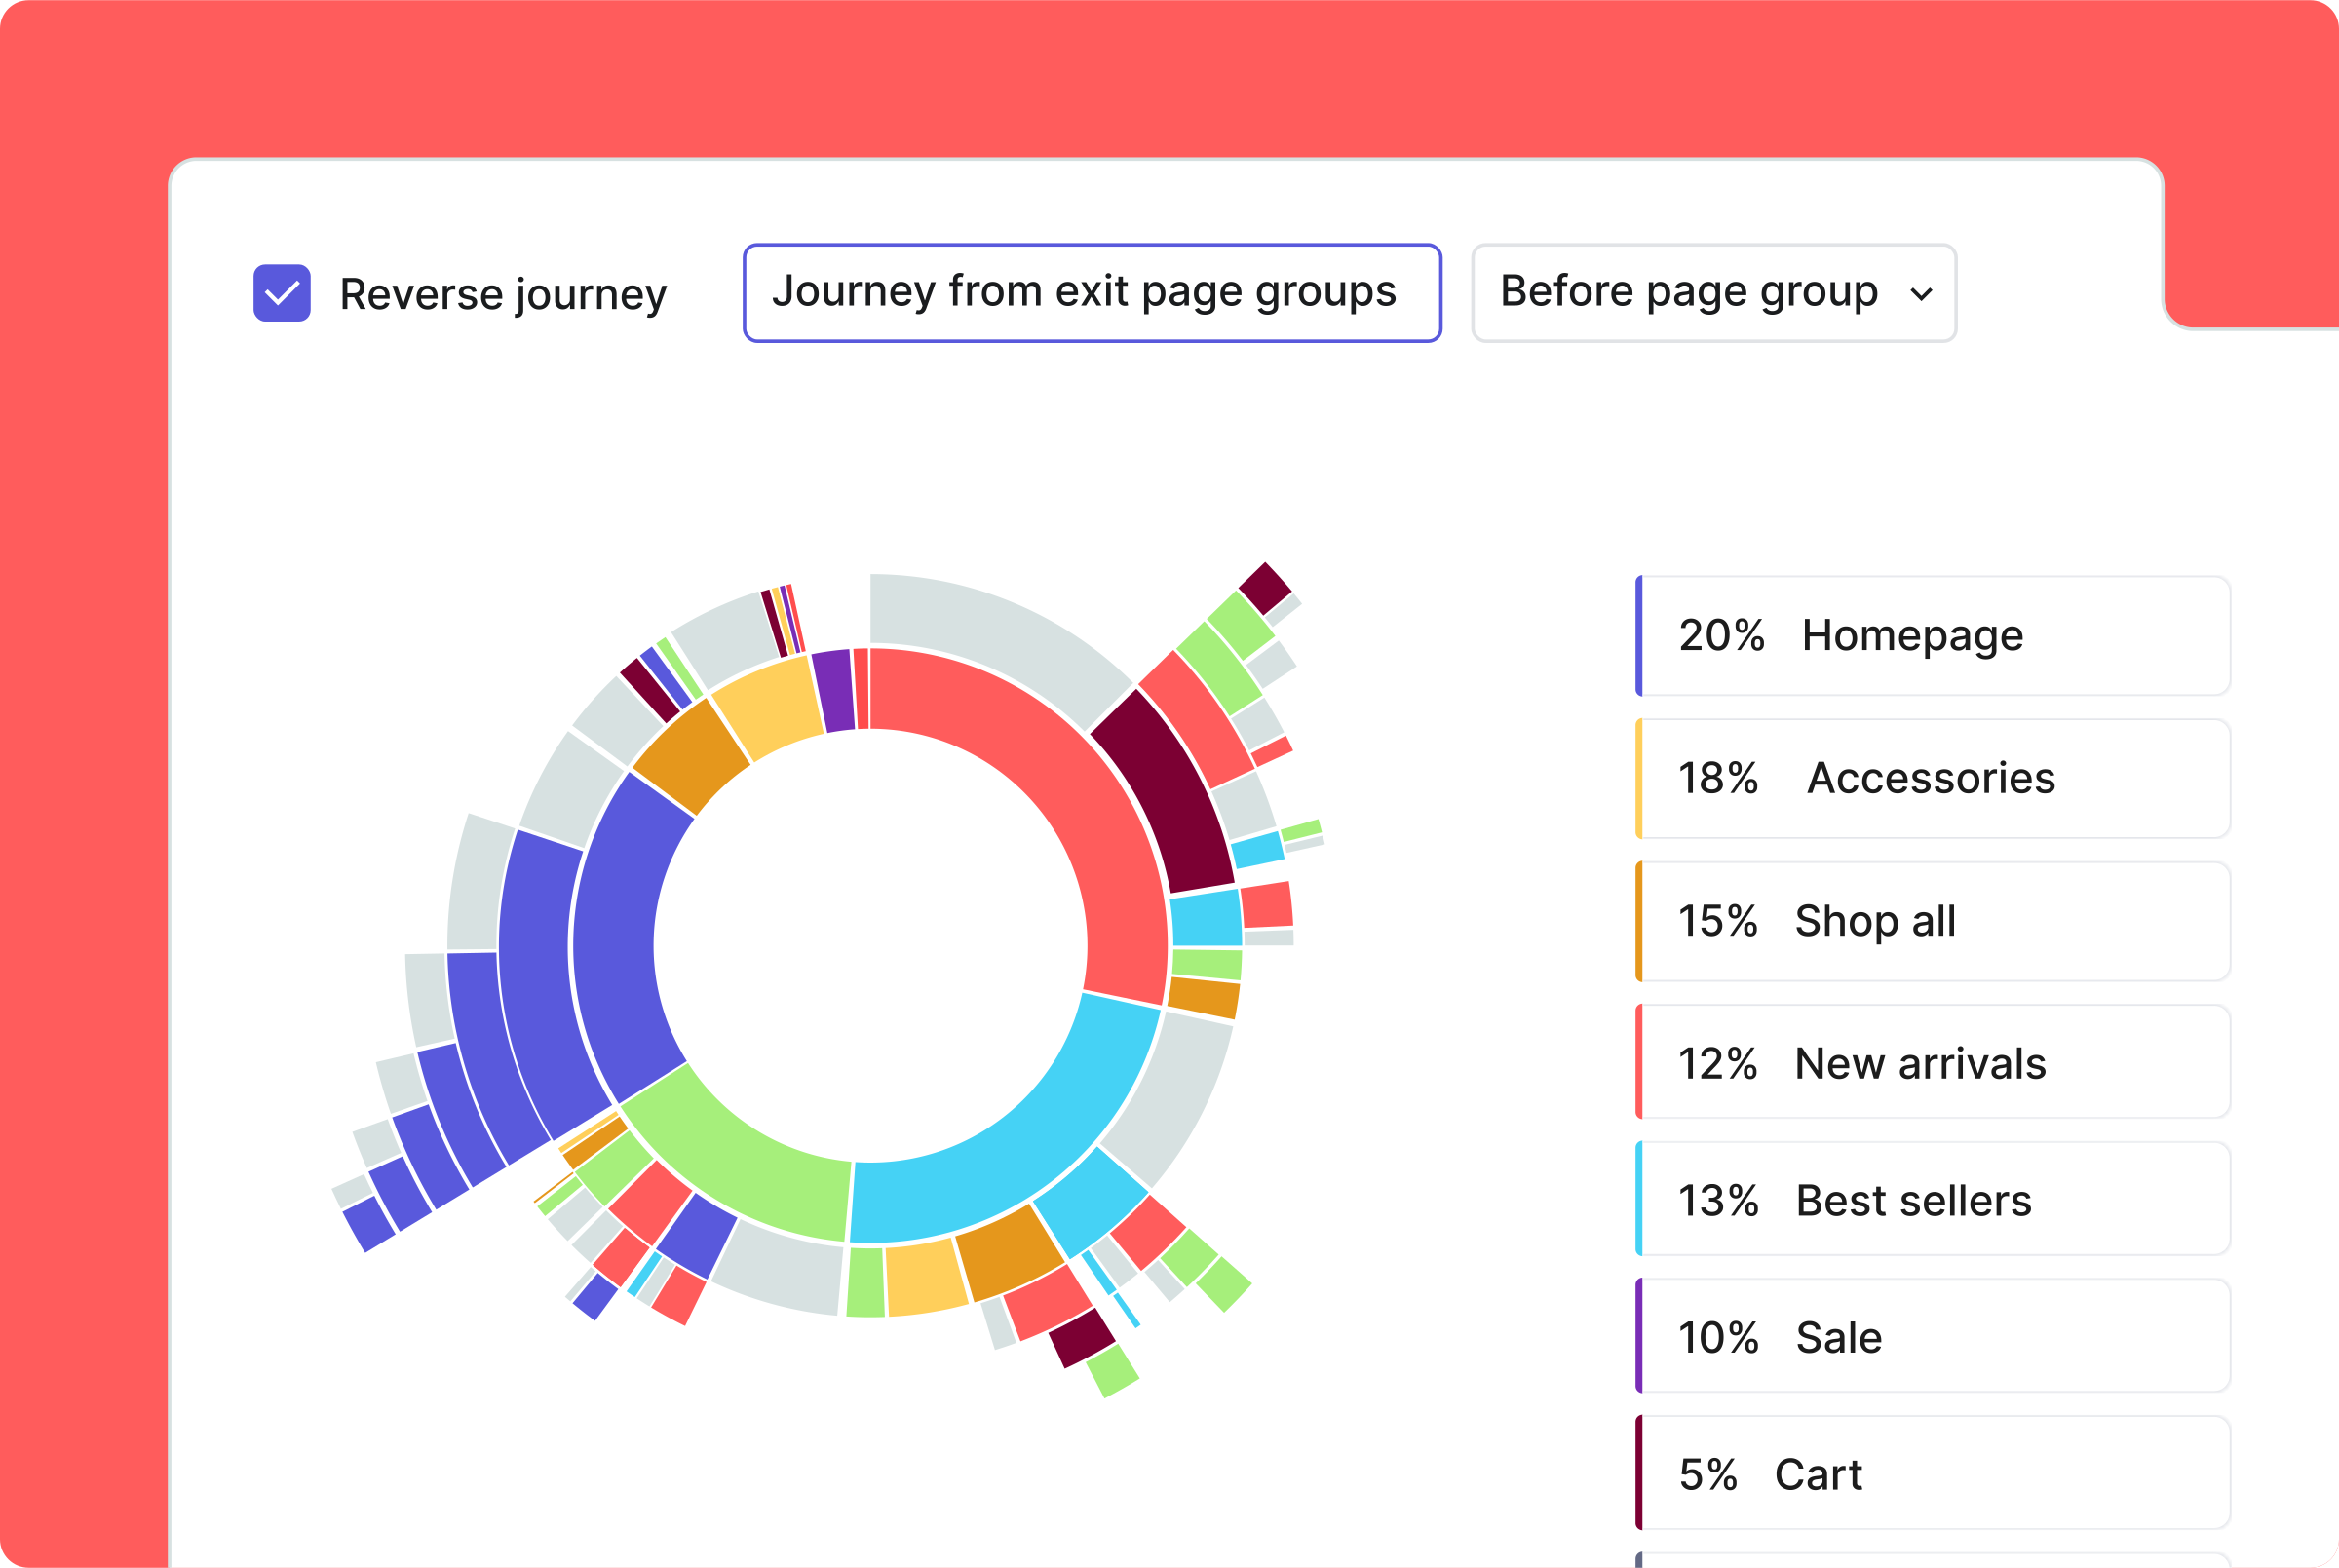 Journey analysis diagrams map multi-path customer navigation, highlighting unexpected exit funnels and reverse loops
Modern Single-Page Applications (SPA) built on React, Angular, or Vue introduce technical hurdles for legacy web analytics. Because page transitions occur without full browser document reloads, older tracking tags fail to detect route changes accurately. Contentsquare monitors virtual routing, browser history Application Programming Interface (API) routes, and dynamic component rendering to maintain uninterrupted behavioral continuity across 15-step checkout sequences.
Customer journeys frequently span multiple sessions and disconnected devices. Contentsquare correlates authenticated user tokens across desktop and mobile touchpoints, building longitudinal conversion histories. Analysts observe how exploratory mobile browsing sessions culminate in completed desktop purchases three days later.
Reverse pathway modeling identifies common interaction patterns preceding sudden session abandonment. Analysts examine the final three interaction steps prior to cart abandonment, isolating confusing shipping estimators that cause customer drop-offs. Product teams eliminate these bottlenecks before launching international storefronts.
Marketing teams connect multi-channel attribution data from systems like Supermetrics to compare how paid acquisition cohorts navigate compared to organic visitors. Visualizing path deviations by acquisition source reveals whether promotional campaigns drive qualified customers or disoriented traffic that bounces instantly. Teams leverage these pathway insights to restructure conversion funnels, eliminating redundant checkout steps and streamlining user onboarding flows.
“True digital experience optimization requires understanding the silent majority of visitors who abandon shopping journeys without ever submitting a customer support ticket or filing a bug report.”
5. Detecting Friction with Real User Monitoring and Error Tracking
User experience friction often stems from underlying client-side code defects rather than confusing layout typography. A slow third-party tag, an unhandled Promise rejection, or a failing payment gateway Application Programming Interface (API) can silently halt transactions across thousands of customer sessions.
Contentsquare bridges digital marketing and engineering workflows through integrated Real User Monitoring (RUM) and Error Analysis. The platform correlates JavaScript runtime exceptions and network request failures directly with lost commercial revenue. When an engineering release introduces a script bug on the payment page, the system alerts technical teams with precise financial impact estimates.
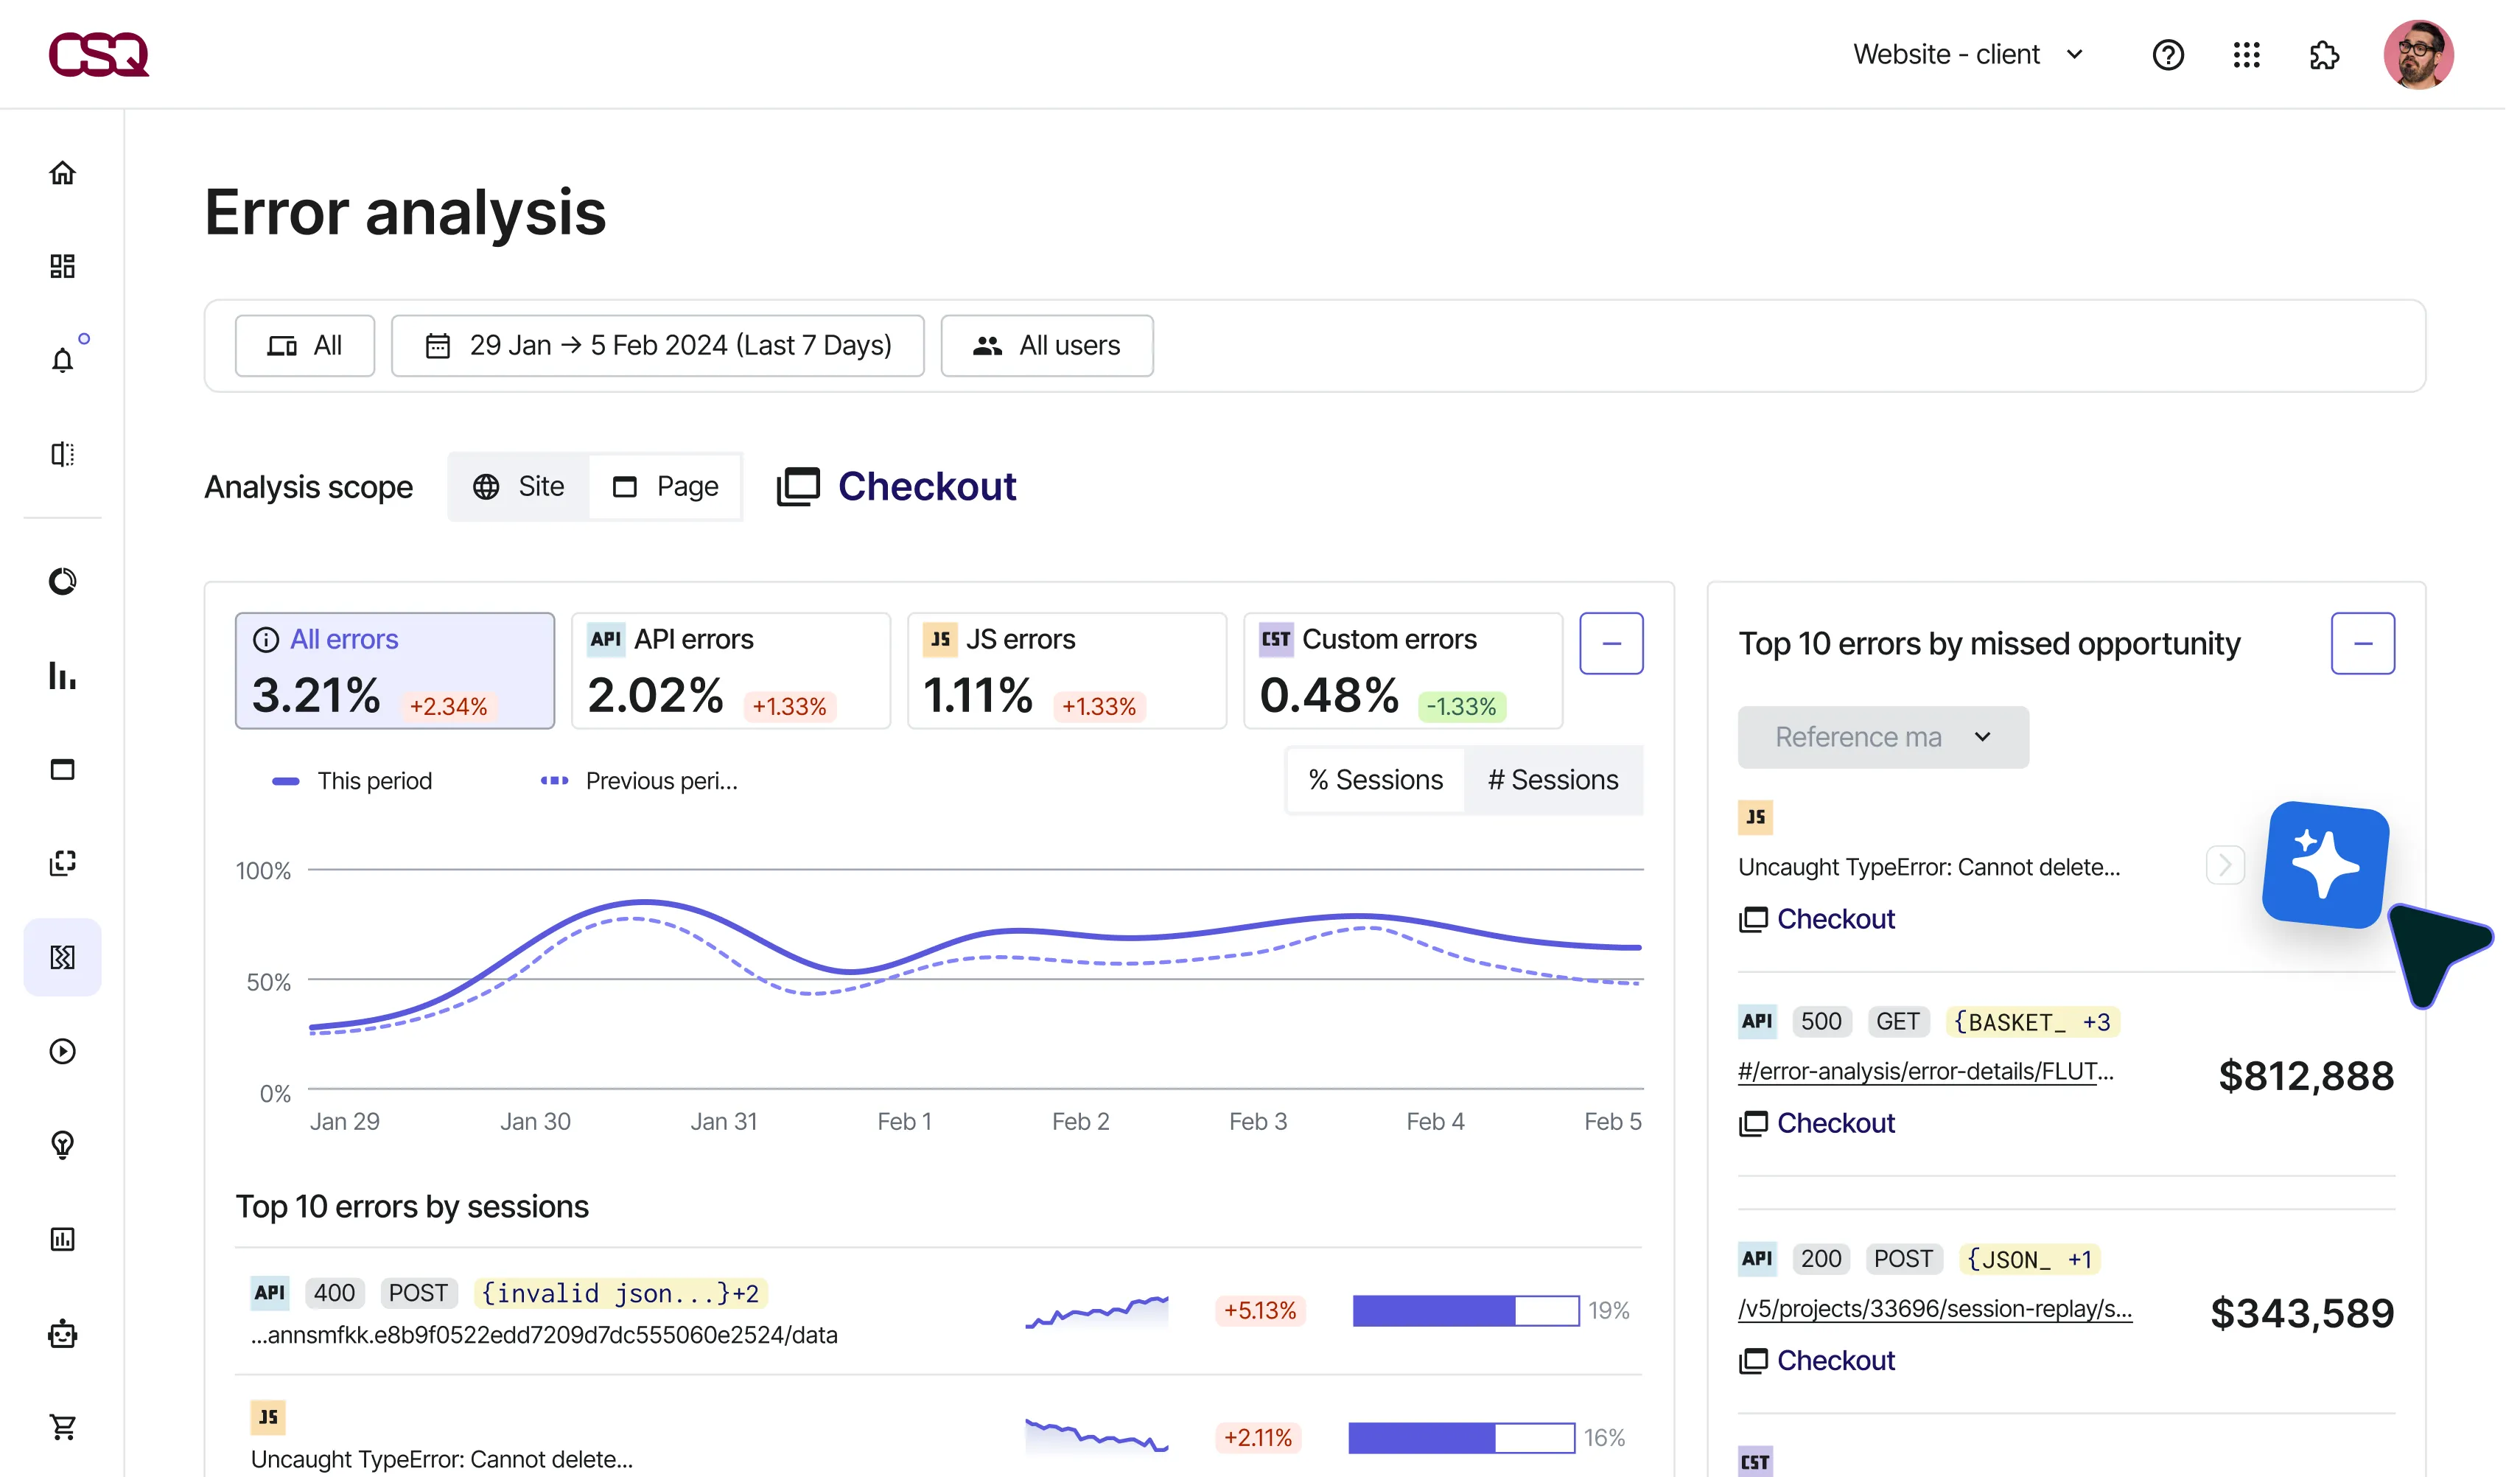 Error analysis dashboards aggregate JavaScript exceptions, slow network payloads, and API status codes with business impact
Engineering squads leverage structured diagnostics to reproduce technical defects without requesting manual debugging logs from frustrated customers. Automated diagnostic logs pinpoint the root cause of interface regressions rapidly:
- Stack Trace Extraction: Captures exact JavaScript error messages, browser operating system versions, and viewport dimensions associated with failing client sessions.
- Network Payload Auditing: Logs HTTP response status codes, payload latencies, and third-party script timeouts that block checkout processing.
- Core Web Vitals Telemetry: Measures Largest Contentful Paint (LCP), Interaction to Next Paint (INP), and Cumulative Layout Shift (CLS) across live user populations.
- Session Replay Linking: Enables developers to jump directly from a server error log into the exact session replay frame where the defect occurred.
Correlating code anomalies directly with transaction values transforms engineering triage. Development teams resolve critical checkout bugs within hours because the platform quantifies the exact financial loss of unhandled API exceptions. Real-time alerts dispatch through webhook endpoints into PagerDuty and Jira, ensuring site reliability engineers act before conversion drops trigger revenue alerts.
6. Autonomous Insights with Sense AI and Model Context Protocol
Contentsquare integrates artificial intelligence to relieve analytics teams from repetitive manual query configuration. The Sense AI suite scans millions of behavioral data points continuously, surfacing anomalous conversion drops and shifting interaction patterns without human intervention. Instead of manually building hundreds of segment filters, business analysts receive contextual alerts describing specific page components that deviate from expected seasonal baselines by more than 15 percent.
The platform pioneers deep enterprise connectivity by adopting the Model Context Protocol (MCP). Dedicated MCP server endpoints support 300 tool calls monthly on Free plans up to 108,000 calls annually on Enterprise agreements. External Large Language Models (LLM) query real-time experience metrics securely through these connectors. AI agents retrieve frustration scores, analyze API error logs, and inspect journey funnels using natural language prompts.
This programmatic accessibility transforms corporate intelligence operations, cutting routine data extraction workloads by approximately 35 percent. Product managers query internal Slack bots to verify weekly checkout drop-off rates, while automated engineering agents monitor production deployments for sudden spikes in rage click frequency. Contentsquare bridges raw client telemetry and conversational enterprise automation.
7. Comparing Platform Architecture Against Traditional Product Analytics
Selecting an enterprise analytics platform requires weighing behavioral depth against quantitative event measurement. Digital organizations frequently debate whether to deploy specialized experience analytics platforms like Contentsquare or traditional quantitative trackers like Amplitude and Mixpanel. Contentsquare occupies a distinctive market position by merging retroactive behavioral telemetry with qualitative customer feedback tools.
Following its strategic acquisition of Heap, the platform captures both tagless event streams and deep visual session context, reducing the need for fragmented point solutions. Digital teams export raw interaction events directly into enterprise data warehouses including Snowflake, Google BigQuery, and Amazon Redshift through the Data Connect pipeline. This dual architecture satisfies both product data scientists running SQL queries and UX researchers watching customer recordings.
Event ingestion pipelines maintain sub-second query performance even when evaluating billions of monthly interaction records. In contrast, legacy tools force data teams to maintain complex ETL (Extract, Transform, Load) pipelines to join third-party session recordings with warehouse tables. The following architectural matrix illustrates key functional differences across leading platforms:
| Capability & Architecture | Contentsquare DXA | Amplitude Analytics | Hotjar (Legacy Standalone) |
|---|---|---|---|
| Behavioral Capture Model | Automatic tagless DOM capture | Explicit code-level event logging | Session sampling and page heatmaps |
| Revenue Attribution | Zone-based transactional attribution | Funnel conversion calculation | No native financial attribution |
| AI Integration & Agents | Sense AI, summaries, and MCP server | Ask Amplitude natural language AI | Basic AI survey sentiment parsing |
| Data Retroactivity | 100% retroactive event querying | Forward-only from tag deployment | Limited retroactive page tagging |
| Product Analytics Depth | High (via integrated Heap engine) | Industry benchmark for product telemetry | Low (focused primarily on qualitative UX) |
| Ideal Deployment Scale | Mid-market to Global Enterprise | Growth startups to Enterprise | Small businesses and freelance creators |
For enterprise brands managing complex omni-channel funnels, Contentsquare eliminates the coordination overhead of maintaining separate vendors for session recording, funnel analysis, and survey feedback. Connecting behavioral findings directly into lead attribution platforms like WhatConverts empowers sales reps to review prospect interactions prior to executive calls. Teams verify which case studies prospects browsed before scheduling product demonstrations.
8. Transparent Growth Pricing Versus Enterprise Sales Procurement
Evaluating software investment requires clear visibility into subscription tiers, traffic allowances, and procurement mechanisms. Contentsquare structures its platform into accessible self-serve tiers alongside custom sales-negotiated enterprise plans. The entry Free tier supports 200,000 monthly sessions, one digital project, and one month of numerical data retention. Digital teams test 300 Model Context Protocol tool calls each month without entering credit card credentials.
Growing organizations upgrade to the Growth tier, which starts at $49 per month billed monthly or $39 per month billed annually (representing a 20% discount) for 7,000 monthly sessions. The Growth plan expands retention to 13 months, unlocks zone-based heatmaps, and includes 36,000 annual MCP tool calls across three managed projects. Self-serve teams scale session caps upward dynamically to 240,000+ monthly visits without negotiating custom contracts.
Understanding the boundary between self-serve tiers and bespoke enterprise contracts is essential for budget forecasting. Digital organizations managing multiple international domains require higher project allocations, scaling from 6 projects on Pro to unlimited project environments on Enterprise agreements. The following table summarizes core subscription packages across operational tiers:
| Tier | Starting Price | Session Quota Included | Data Retention Period | Replay Capture Rate | Key Capabilities Included |
|---|---|---|---|---|---|
| Free | $0 / forever | 200,000 monthly sessions | 1 month | 5% (up to 10k sessions) | Basic heatmaps, funnels, error tracking, 300 MCP calls/mo |
| Growth | $49/mo ($39/mo annual) | 7,000 sessions (scales to 240k+) | 13 months | 15% (min 20k sessions) | Zone heatmaps, journey analysis, Sense AI chat, 36k MCP calls/yr |
| Pro | Custom sales quote | Custom volume allocation | 13 to 24 months optional | Up to 100% capture | Cross-device user tracking, RUM, revenue attribution, 72k MCP calls/yr |
| Enterprise | Custom sales quote | Tailored enterprise scale | Up to 24 months optional | Up to 100% capture | Unlimited projects, synthetic monitoring, dedicated SLAs, 108k MCP calls/yr |
Procurement teams must evaluate several commercial considerations before finalizing enterprise commitments with sales representatives. Total cost of ownership frequently extends beyond baseline platform subscription licenses:
- Session Replay Retention Surcharges: While aggregate numerical data remains stored for 13 months on paid plans, visual session recordings are capped at two months on Growth and Pro tiers. Extending replay access to 12 or 24 months requires purchasing optional storage add-ons that increase base contract values.
- Traffic Spikes and Overage Penalties: Operating contracts specify strict monthly session caps. Exceeding contracted thresholds during seasonal promotions (such as Black Friday or Cyber Monday) can trigger substantial overage surcharges unless buffered during initial contract negotiations.
- Integration Ecosystem Tiers: Free and Growth plans include pre-built integrations for 7 and 9 platforms respectively, while comprehensive connectivity to 115+ enterprise tools (including Adobe Analytics and Optimizely) is reserved for Pro and Enterprise agreements.
- Implementation and Onboarding Services: Enterprise deployments typically mandate specialized onboarding packages covering tag governance, privacy configuration, and staff training. These professional services add upfront capital expense during the initial implementation quarter.
Enterprise buyers should negotiate traffic buffers of 10% to 20% above forecasted session volumes to avoid penalty fees during high-traffic quarters. Multi-year commitments often unlock bundled onboarding workshops and dedicated customer success architects.
9. Contentsquare Technical Trade-Offs and Operational Strengths
Adopting an enterprise-grade digital experience platform introduces substantial operational benefits alongside distinct organizational trade-offs. Successful deployment requires dedicated analytical resources, clear governance guidelines, and realistic implementation timelines. Large organizations move fast. However, without disciplined tagging governance and clean user roles, dashboards quickly become cluttered with abandoned experiments and redundant visual segments.
Team training remains essential. Organizations that designate dedicated analytics champions achieve faster return on investment than teams treating the platform as passive reporting software. Regular cross-functional reviews between marketing and engineering prevent insights from remaining siloed within analytics units.
What We Liked (Pros)
- Automatic tagless telemetry captures user interactions retroactively without ongoing engineering code maintenance
- Zone analytics links visual interface modules directly to verified transaction checkout revenue
- Sense AI summarizes lengthy session recordings into clear operational incident reports
- Generous free tier provides 200,000 monthly sessions for early prototype validation
- Model Context Protocol support enables autonomous AI models to audit interface friction
- Unified ecosystem incorporates proven behavioral tools from historical Hotjar and Heap integrations
Areas for Improvement (Cons)
- Custom enterprise contracts require lengthy sales negotiations without publicly disclosed pricing schedules
- Aggressive traffic overage fees penalize unexpected seasonal spikes unless negotiated upfront
- Steep initial learning curve demands formal team onboarding to utilize advanced segmentation modules
- Visual session replay data retention is restricted to two months on baseline subscription tiers
Contentsquare excels in environments where digital revenue depends directly on frictionless interface navigation. However, smaller companies with modest traffic volumes may find the platform’s advanced multi-dimensional filtering overwhelming compared to simpler session recorders.
10. Frequently Asked Questions About Contentsquare
Contentsquare is an enterprise digital experience analytics platform that captures all user interactions automatically through a lightweight script without requiring manual event tagging in code.
Contentsquare acquired Hotjar in September 2021 to power its self-serve feedback tools, followed by Heap in December 2023 to integrate retroactive product analytics into a unified telemetry ecosystem.
No. The tracking tag weighs under 50 KB compressed, loads asynchronously through global edge networks, and bundles telemetry beacons to protect browser main thread execution.
Zone analytics isolates interactions on specific design modules, cross-referencing buyer session revenue with element engagement to show exact conversion contribution per page component.
Contentsquare exposes telemetry endpoints via Model Context Protocol servers, enabling external artificial intelligence models to inspect user friction scores and journey metrics directly.
High-volume ecommerce brands and enterprise software platforms needing visual root-cause diagnosis, revenue-backed prioritization, and automated behavioral tracking benefit most from Contentsquare.
11. Final Implementation Verdict on Contentsquare
Contentsquare stands as a leading digital experience analytics solution for mid-market and global enterprise organizations. Pairing tagless client-side telemetry with zone-based revenue attribution transforms ambiguous user interaction data into clear financial roadmaps for conversion rate optimization.
Organizations managing high-volume ecommerce storefronts, complex financial portals, or multi-step subscription funnels will achieve swift return on investment through reduced developer tagging overhead and faster defect remediation. Conversely, early-stage startups and low-traffic websites should leverage the generous free tier or explore entry-level visual recorders before committing capital to enterprise multi-year contracts.
Clear governance and strategic onboarding ensure digital teams translate visual behavioral signals into measurable conversion gains. For enterprises seeking to bridge quantitative funnels and qualitative user friction, Contentsquare remains an exceptional technological foundation.

Contentsquare sets the benchmark for enterprise digital experience analytics by combining tagless event capture, zone-based revenue attribution, and modern AI automation. While high-tier contract pricing and replay retention caps demand careful procurement review, its ability to pinpoint client friction and quantify lost revenue makes it an indispensable asset for digital growth teams.